Dogecoin Price Set to Rebound to $0.20 After Symmetrical Triangle Breakout


Highlights
- Dogecoin price holds at $0.13, testing key support level.
- Symmetrical triangle breakout could drive DOGE price to $0.20.
- Technical indicates a bearish divergence, with potential for further downward pressure.
Dogecoin price is holding steady at $0.13, despite a recent 5% drop. The broader crypto market faces a bearish trend. Over the past 24 hours, Dogecoin has traded below $0.14. This mirrors the market’s overall struggles.
The crypto market has dropped by 2.3%, extending a 13.8% monthly decline.
The crash comes as markets react to the Federal Reserve’s third rate cut in 2025. The rate cut failed to spark optimism, amplifying market uncertainty.
A selloff in Oracle-led tech stocks added to the pressure. Additionally, a $166 million liquidation wave in BTC long positions worsened the situation.
Despite these challenges, analysts are hopeful for a Dogecoin rebound. A breakout from its symmetrical triangle pattern could push the price back to $0.20.
Dogecoin Price Targets Key Support in Symmetrical Triangle Pattern
Crypto Trader Tardigrade has pointed out Dogecoin’s current price action. The coin recently touched a key support level in a symmetrical triangle pattern. This could indicate a potential upward movement.
$Doge/12-hour#Dogecoin hits another touchpoint on the lower support line of the symmetrical triangle, setting up to complete a bottoming pattern 🔥 https://t.co/lju2cQt7yF pic.twitter.com/jA1dOoBljE
— Trader Tardigrade (@TATrader_Alan) December 11, 2025
On the weekly chart, the Dogecoin price is holding strong at a significant support level. This stability has raised expectations for a possible surge toward $1.
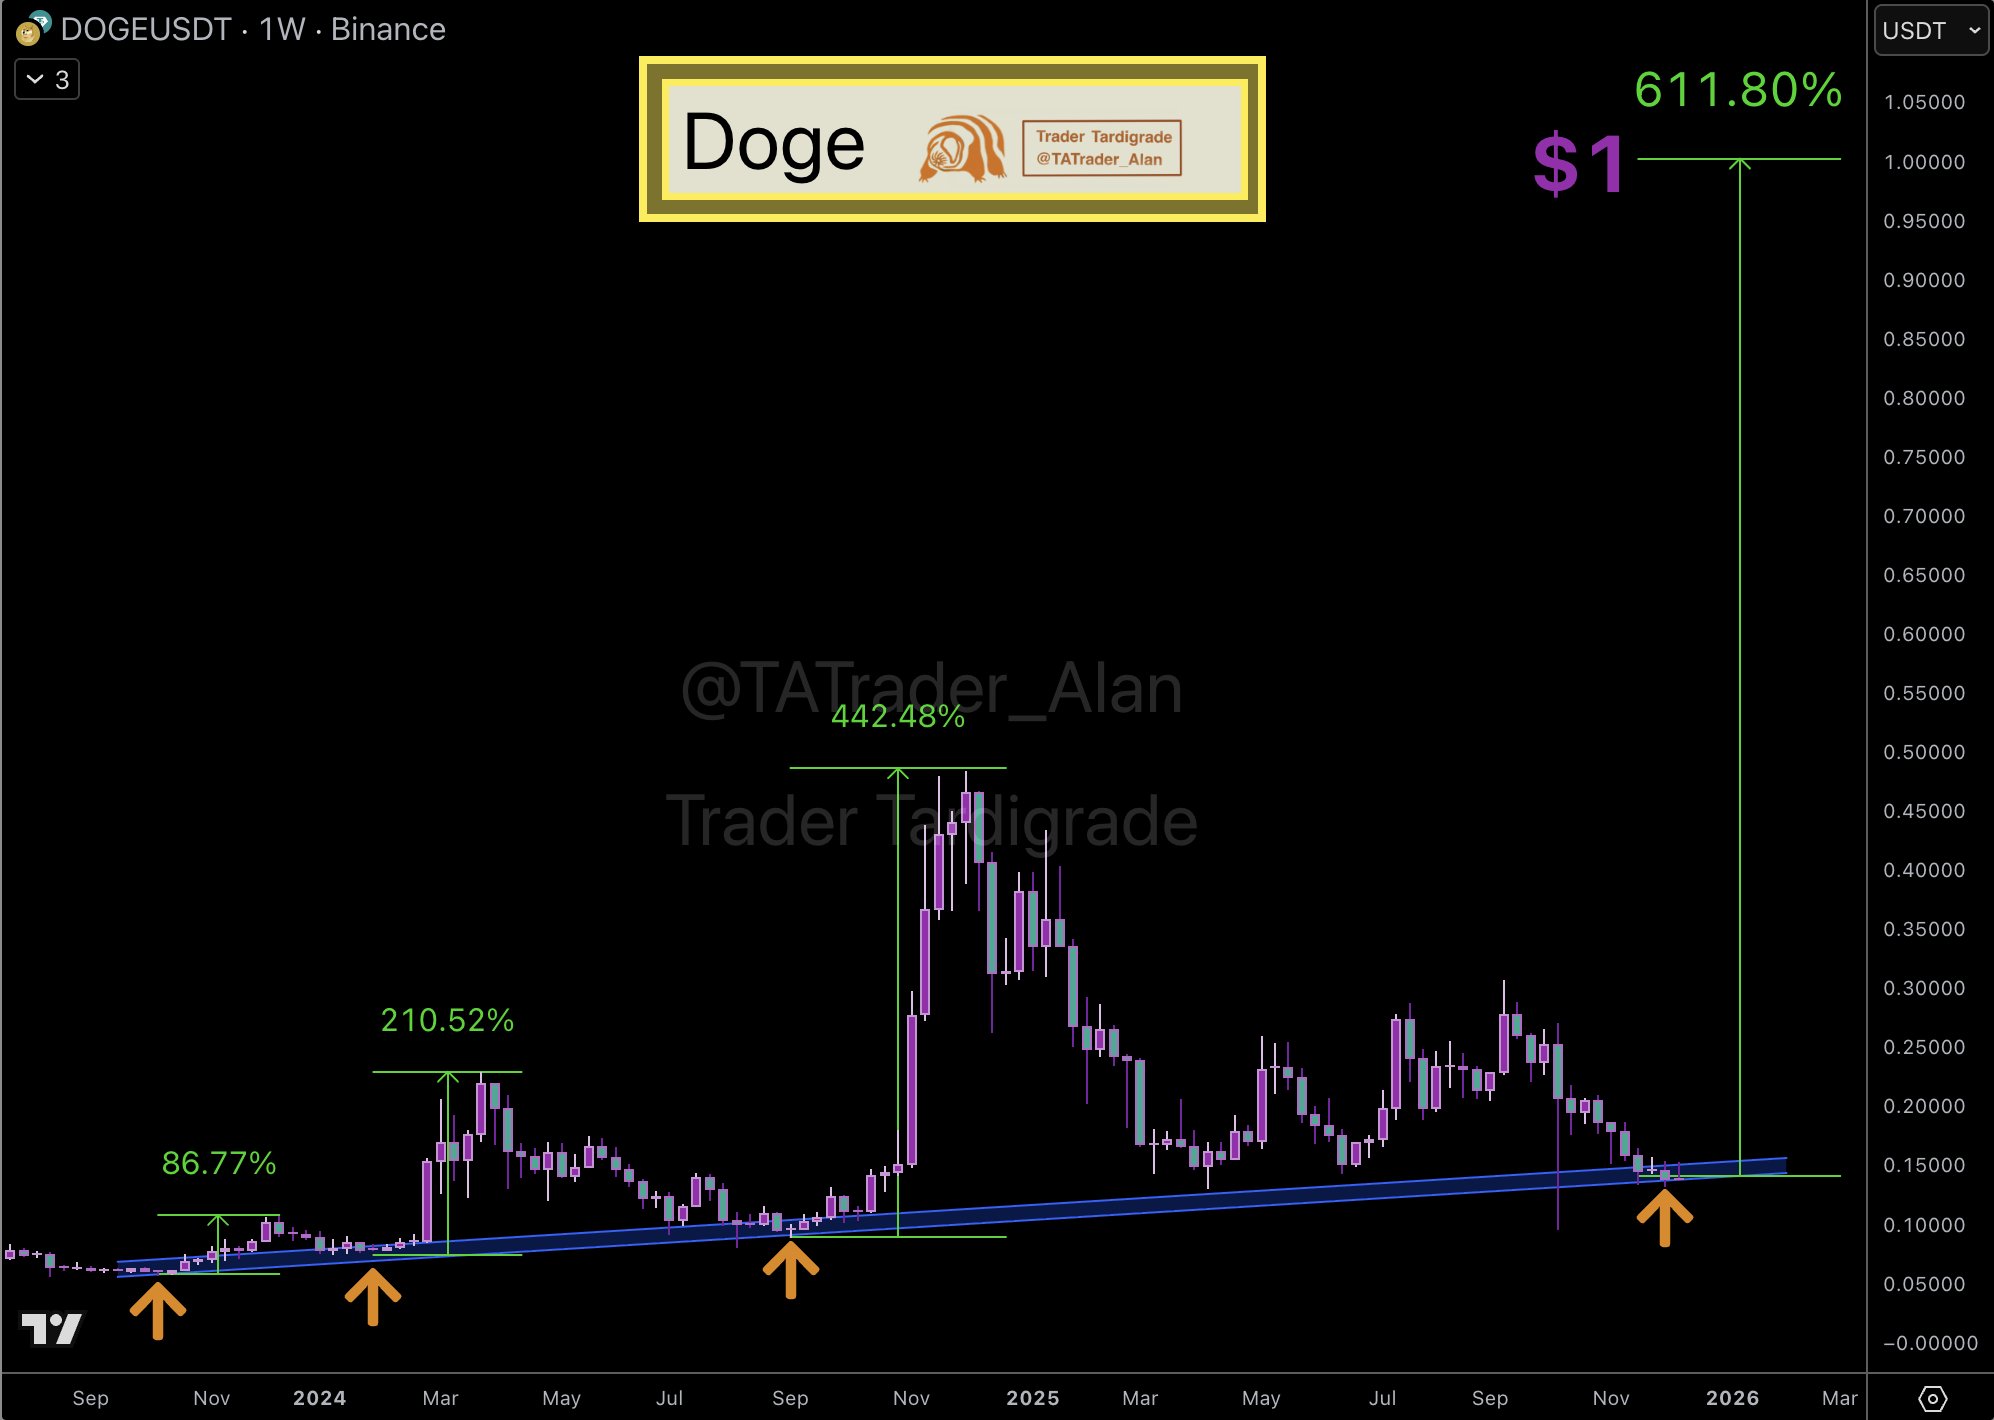
If the support level holds, analysts believe Dogecoin could see a potential increase of up to 600%. This marks a critical moment for traders.
Is DOGE Price Poised for a Breakout or a Downturn?
As of the time of reporting, the DOGE price stands at $0.1343, experiencing a dip of 5%. The price has shown fluctuations in recent days, with notable resistance around the $0.15 mark. At present, DOGE is testing the support level near $0.13, which will be crucial for its next move.
The Relative Strength Index (RSI) is currently at 51, indicating a neutral market sentiment. The Moving Average Convergence Divergence (MACD) indicator shows a bearish divergence.
The MACD line crosses below the signal line, which could suggest further downward pressure on the price. The histogram is negative, reinforcing the bearish outlook.
A continuation of the current trend may lead to a test of the support at $0.13, where the Dogecoin price outlook for the long term might look for a rebound.
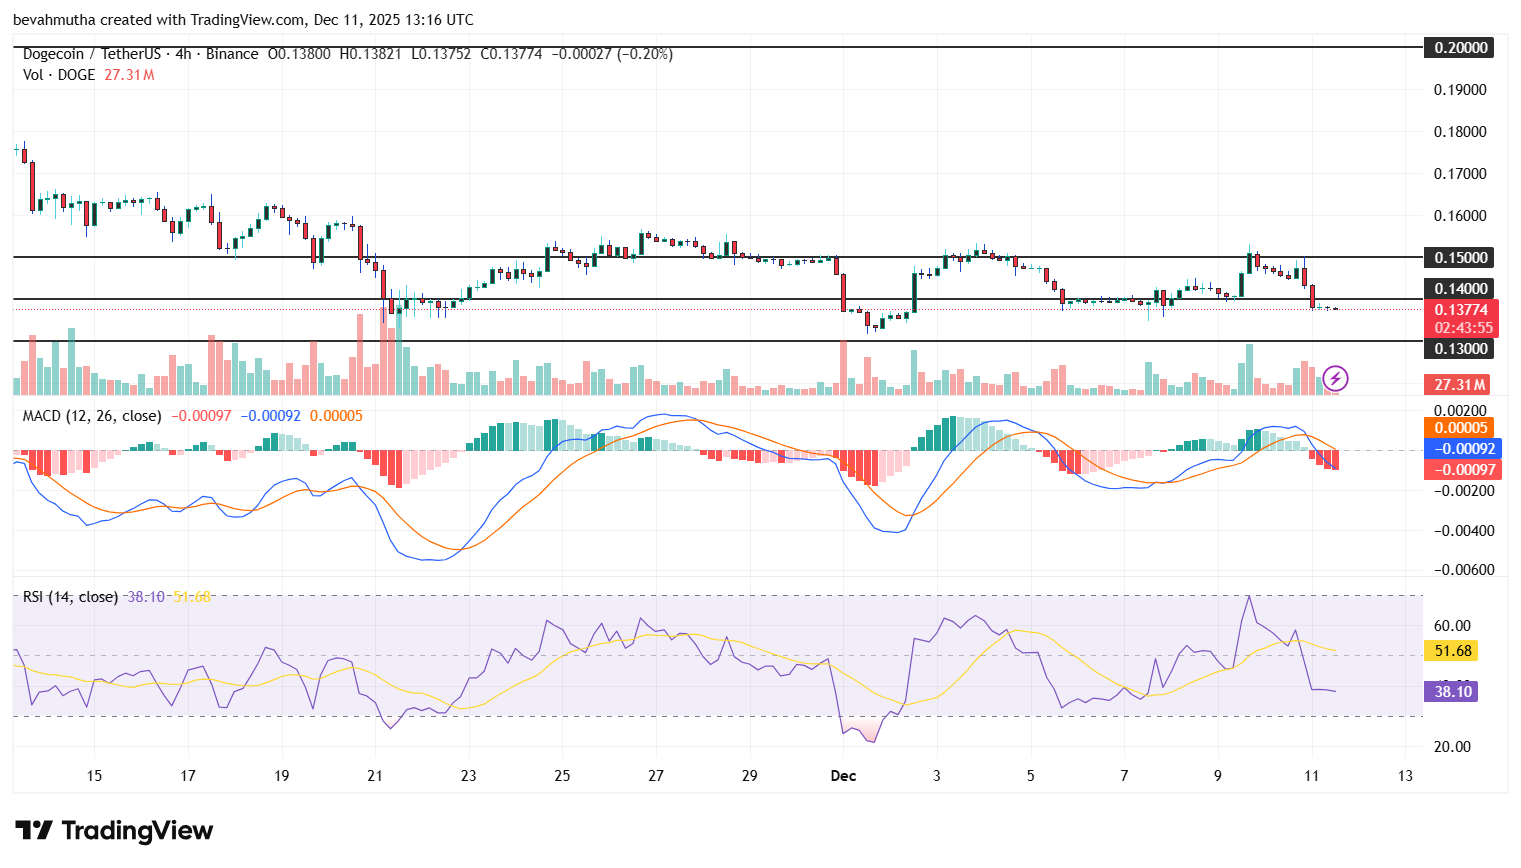
For traders, the immediate focus should be on the $0.13 support zone. A break below this level could open up further downside potential, targeting the next key level of $0.1250.
On the upside, the $0.14 to $0.15 range represents the next resistance areas that DOGE would need to clear to establish a bullish trend.
Frequently Asked Questions (FAQs)
1. What is the significance of the $0.13 support level for DOGE?
2. What technical pattern is Dogecoin currently following?


- Breaking: 21Shares XRP ETF Launches as XRP Funds Extend Inflows Streak
- Are DATs Being Targeted? Strategy CEO Questions MSCI’s Proposed Exclusion From Global Indices
- Crypto Bill Talks Stall as Senate Democrats Push Back on Stablecoin Yield Provisions
- Breaking: Coinbase Adds Supports For Solana Tokens On DEX Trading
- Big Short’ Michael Burry Issues Dire Warning on US FED’s $40B T-Bills Buy Plan
- Here’s Why Solana Price Could Explode to $150 Soon
- XRP Price Hits Crucial Support as ETF Inflows and Top RLUSD Metrics Soar
- Dogecoin Price Set to Rebound to $0.20 After Symmetrical Triangle Breakout
- Cardano Price Dips 10% as Midnight Token Launch Turns Sour
- Bitcoin Price Holds $90k as Markets React to Fed Rate Cut: Will BTC Rally to $100k or Fall to $80k?
- Dogecoin Price Eyes $0.30 as Bullish Crossover Pattern Signals a Trend Shift


Why Trust CoinGape
CoinGape has covered the cryptocurrency industry since 2017, aiming to provide informative insights Read more…to our readers. Our journal analysts bring years of experience in market analysis and blockchain technology to ensure factual accuracy and balanced reporting. By following our Editorial Policy, our writers verify every source, fact-check each story, rely on reputable sources, and attribute quotes and media correctly. We also follow a rigorous Review Methodology when evaluating exchanges and tools. From emerging blockchain projects and coin launches to industry events and technical developments, we cover all facets of the digital asset space with unwavering commitment to timely, relevant information.
Premium Partners


