EOS Price Analysis: Will The Euphoria Continue Post $1.30; Buy Or Sell?


EOS price analysis shows the continuation of the upside momentum but with limited price action. The buyers meet the critical supply zone after surging more than 12% in the previous session. Currently, the EOS price is in consolidation mode. As the price comfortably trades above the crucial 20-day and 50-day moving averages, a higher probability of upside continuation can be anticipated.
- EOS price prints modest gains post spectacular single-day rise.
- The bulls hold near the critical resistance level amid the completion of a bullish rounded formation on the daily chart.
- An upside 0f 20% in the offer if the price manages to give a daily closing above $1.30.
As of writing, EOS/USD is trading at $1.28, up 2.4% for the day. The 24-hour trading volume is holding at $356,869,038 with 56% gains. A high price with high volume is a bullish sign.
EOS price looks for another leg up
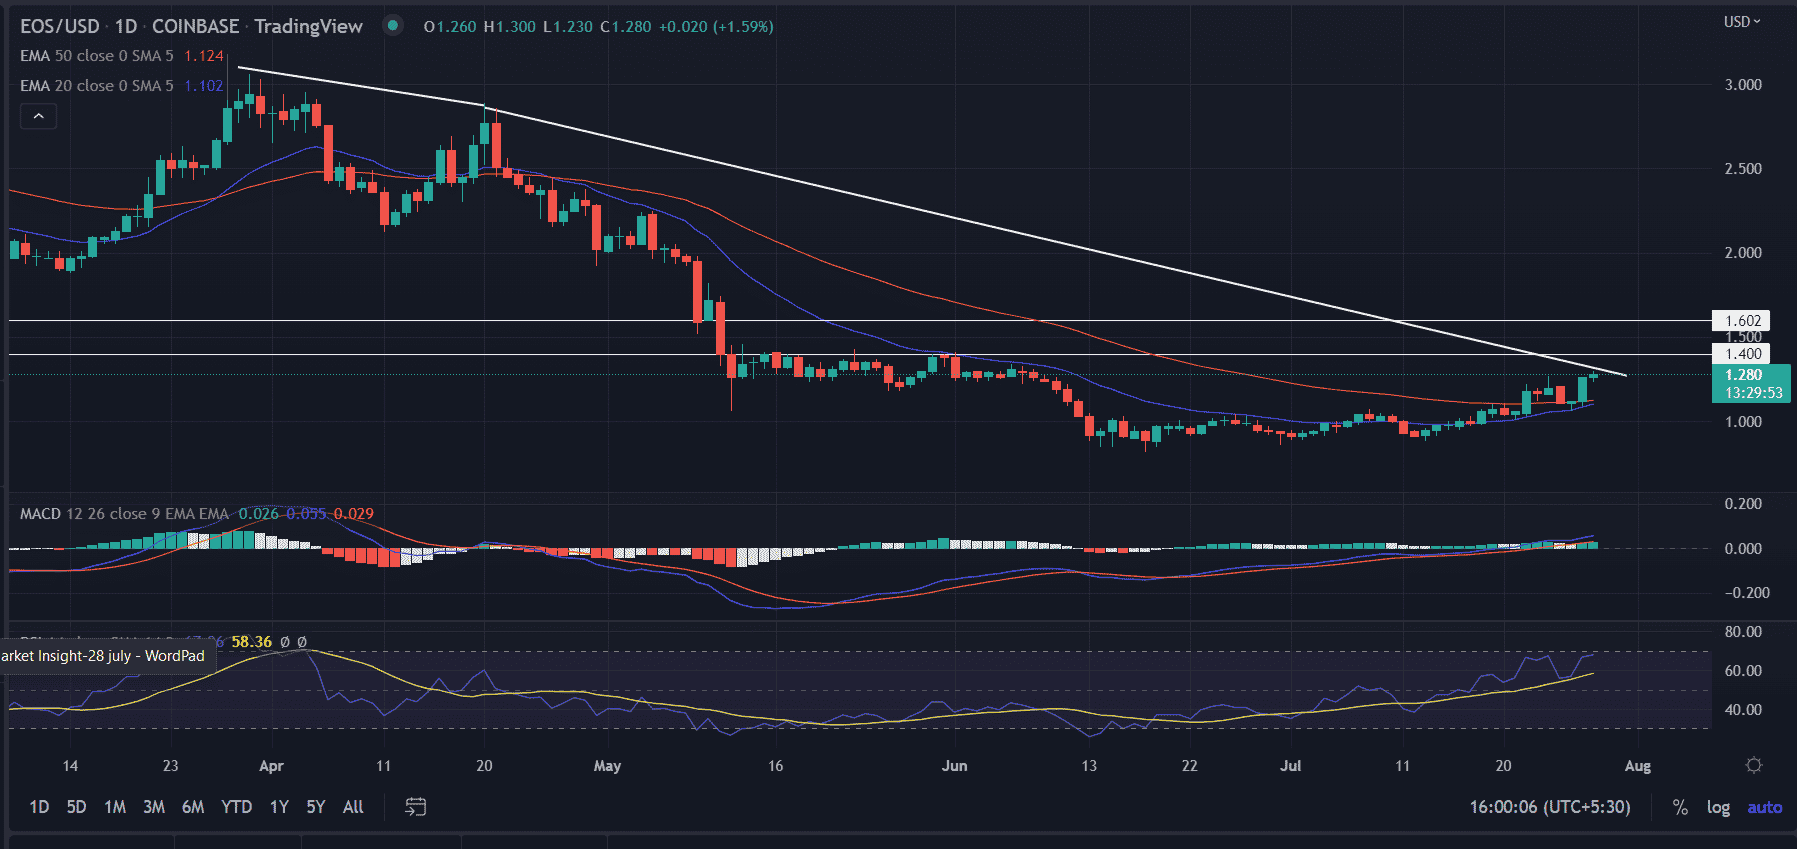
On the daily chart, the EOS price analysis marks a period of consolidation near the session’s high. The descending trend line from the highs of $3.18 acts as a strong upside barricade for the EOS buyers. The price has completed a ‘rounded bottom’ formation. Thus, facing challenges near the $1.30 mark.
Now, a renewed buying pressure would push the price above the bearish trend line. If that happens, the EOS price would immediately meet the $1.40 resistance level. Further, an acceptance above the mentioned support-turned resistance level would mean the bulls are likely to take out the $1.60 horizontal resistance level next.
On the other hand, a break below the session low would discard the bullish arguments. In that case, the price could fall back to the previous day’s low at $1.09.
Technical indicators:
RSI: The RSI (14) is currently trading at 66 and it is shaping a curve that indicates a probable consolidation. More confirmation is needed to act upon in the current scenario.
MACD: The MACD is moving above the midline as the green line stays above the orange line. The rising histogram confirms the strength in the uptrend.
How to trade:
EOS coin price analysis indicates a positive bias on the daily chart. But faces a sideways movement for now. Investors should wait for a daily close above $1.30 and an uptick in RSI for fresh long positions.
Support: $1.23 and $1.15
Resistance: $1.35 and $1.40

Why Trust CoinGape
CoinGape has covered the cryptocurrency industry since 2017, aiming to provide informative insights Read more…to our readers. Our journal analysts bring years of experience in market analysis and blockchain technology to ensure factual accuracy and balanced reporting. By following our Editorial Policy, our writers verify every source, fact-check each story, rely on reputable sources, and attribute quotes and media correctly. We also follow a rigorous Review Methodology when evaluating exchanges and tools. From emerging blockchain projects and coin launches to industry events and technical developments, we cover all facets of the digital asset space with unwavering commitment to timely, relevant information.
Related Articles


- Bitcoin Crashes to $72k as U.S.–Iran Tensions Rise After Talks Collapse
- Bringing Compute Power to the Masses in a Sustainable, Decentralized Manner
- Bitcoin Reserve: U.S. Treasury Rules Out BTC Buys as GOP Senators Push For Use Of Gold Reserves
- Epstein Files: How Jeffrey Epstein Had Ties to Bitcoin and Crypto’s Early Development
- Crypto Market Continues to Plunge, Could 2026 Be the Worst Year?
- Dogecoin Price Prediction After SpaceX Dogecoin-Funded Mission Launch in 2027
- Solana Price Crashes Below $95 for the First Time Since 2024: How Low Will SOL Go Next?
- Ethereum Price Eyes a Rebound to $3,000 as Vitalik Buterin Issues a Warning on Layer-2s
- Pi Network Price Outlook as Bitcoin Faces a Strong Sell-Off Below $80k
- Bitcoin Price Prediction As US House Passes Government Funding Bill to End Shutdown
- Ondo Price Prediction as MetaMask Integrates 200+ Tokenized U.S. Stocks


