ERON Price Analysis: Emerging Bullish Pattern Foretells 65% Rise In ERON


The ERON projects share their two main goals: providing basic human facilities to needy people and building a suitable and effective blockchain ecosystem. ERON is their native token which is used to maintain their ecosystem. Furthermore, among their multiple services, they have plans to launch their official exchange of the ERON blockchain- ERONbit this month(May 2022).
The ERON technical chart shows early signs of a bullish rounding bottom pattern as the coin price sustains above the $0.00006 mark. The expected rally should surge the altcoin to the $0.0001 mark, indicating a 65% gain from its current value.
Key points
- The ERON buyers mount stiff support at $0.0006
- A Rising RSI slope suggests an upcoming rally in ERON price
- The 24-hour trading volume in the ERON coin is $271.5K, indicating a 1.73% loss
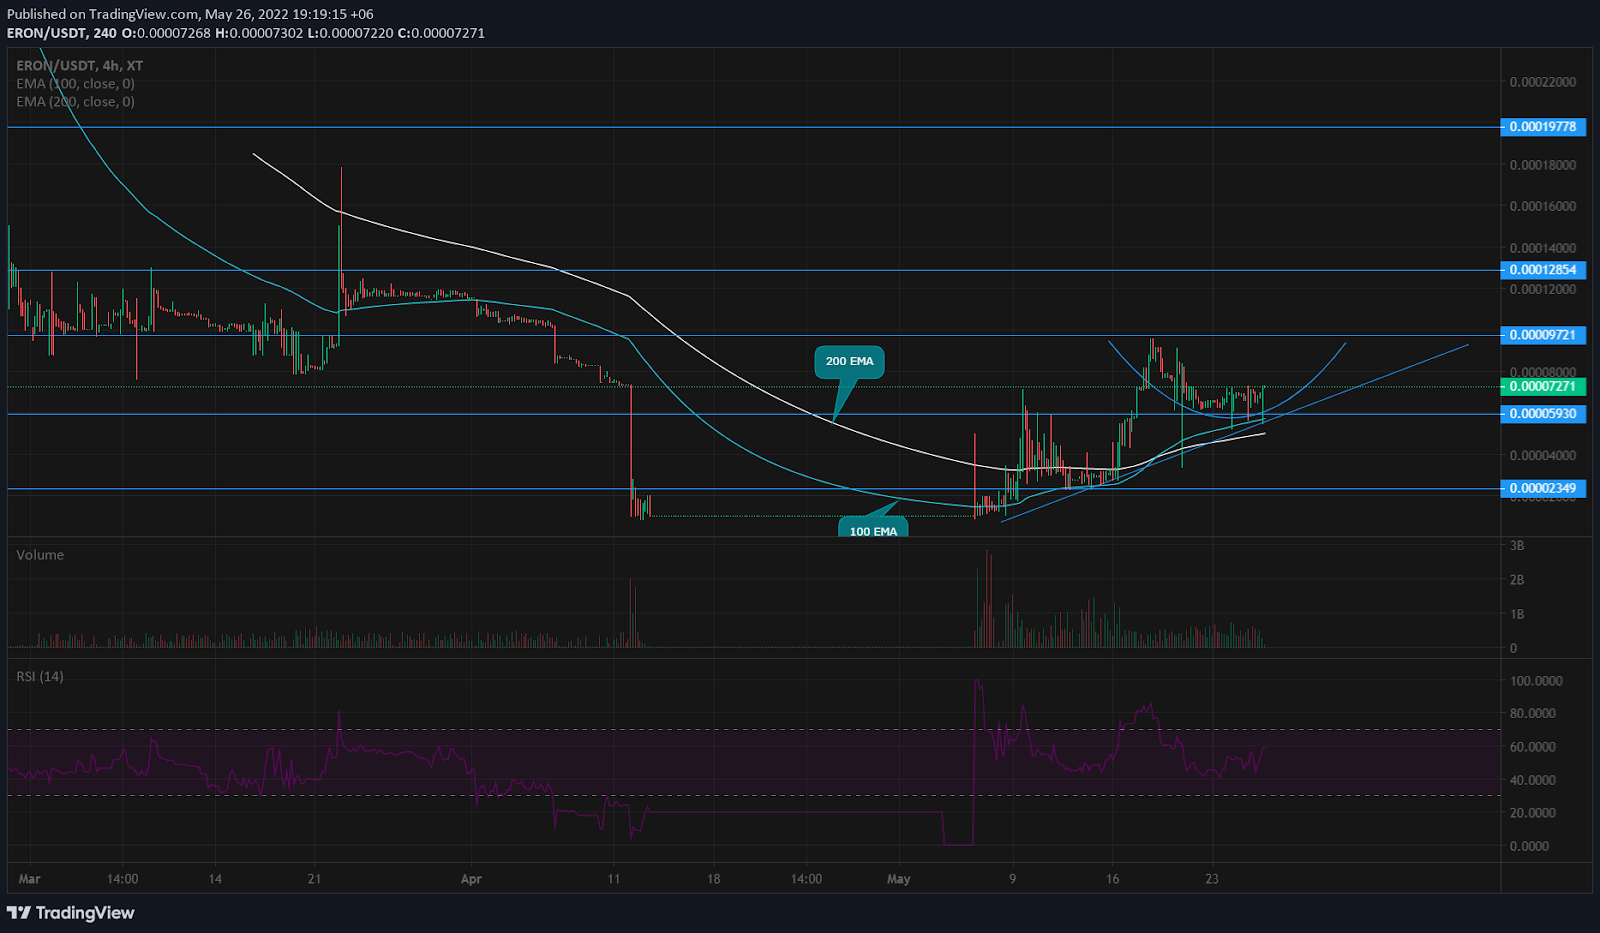
Responding to the widespread correction in the crypto market, the ERON price witnessed a significant downfall and plunged to a new low of 0.000008209 on April 13th. For nearly a month, the coin wavered near this value, but the growing interest of buyers triggered a fresh recovery rally.
Thus, a set of new higher highs and higher lows registered a 750% gain within a fortnight as the price hit the $0.00009541 mark. However, the last bearish pullback has retraced the ERON price to $0.00006, discounting the altcoin by 35%.
Furthermore, multiple retests to this psychological level indicate the buyers are aggressively defending this support, and the sustained price may resume the prevailing trend. The rising price hints at the formation of a rounding bottom pattern with the neckline at $0.000096.
Under this pattern influence, the ERON price should breach the mentioned neckline and drive the bull run 28% higher to $0.00012.
On a contrary note, a fallout to this support would extend the correction to $0.00000435 or $0.027.
Technical indicator
RSI indicator: Despite a lateral walk-in price action, the RSI slope rallying higher suggests a rise in underlying bullishness. This positive divergence bolsters the bullish pattern theory to reach the $0.00012 mark.
EMAs: The coin chart shows the 100 and 200 EMA act as strong support during the occasional pullbacks. Therefore, this dynamic support maintains the ongoing recovery rally for ERON
- Resistance level- $0.0001 and $0.00012
- Support levels- $0.00006 and $0.000043

Why Trust CoinGape
CoinGape has covered the cryptocurrency industry since 2017, aiming to provide informative insights Read more…to our readers. Our journal analysts bring years of experience in market analysis and blockchain technology to ensure factual accuracy and balanced reporting. By following our Editorial Policy, our writers verify every source, fact-check each story, rely on reputable sources, and attribute quotes and media correctly. We also follow a rigorous Review Methodology when evaluating exchanges and tools. From emerging blockchain projects and coin launches to industry events and technical developments, we cover all facets of the digital asset space with unwavering commitment to timely, relevant information.

Related Articles


- Veteran Trader Peter Brandt Predicts Bitcoin Price Rebound, Gold Fall to $4000
- Peter Thiel Exits ETHZilla as Stock Slides 3% Amid Token Launch
- Bitwise, Granitshares Eyes $63B Sector With New Prediction Markets ETF Filing
- Breaking: Grayscale Sui Staking ETF to Start Trading on NYSE Arca Today
- Prediction Market Lawsuit: Nevada Targets Kalshi in Court After Action Against Polymarket
- Will Sui Price Rally Ahead of Grayscale’s $GSUI ETF Launch Tomorrow?
- How Long Will Pi Network Price Rally Continue?
- Pi Network Price Beats Bitcoin, Ethereum, XRP as Upgrades and Potential CEX Listing Fuels Demand
- 5 Things Dogecoin Price Needs to Hit $0.20 in Feb 2026
- Bitcoin Price Prediction as Experts Warns of Quantum Risks
- Dogecoin, Shiba Inu, Pepe Coin Price Predictions As BTC Crashes Below $68k


