Ethereum (ETH) Price Prediction: ETH Bears Set Eyes On $2,560 ahead of Russia-Ukraine Peace Talks


Ethereum (ETH) price continues to slide down on Thursday as the long-term downtrend extends further. ETH opened lower but recovered quickly to test the session’s high at $2,972.07. However, the rally fizzled out quickly to break the critical $2,900 mark.
- Ethereum (ETH) price trades lower on Thursday amid market uncertainty and volatility.
- ETH remains pressured below 200-EMA at $3,245.
- A bearish pattern formed on March 2 could result in a 12% descent from the current levels.
As of press time, ETH/USD is exchanging hands at $2,904.32, down 1.56% for the day. The second-largest crypto currency’s 24-hour trading volume holds at $345,782,416,688 as per the CoinMarketCap.
ETH set to decline further
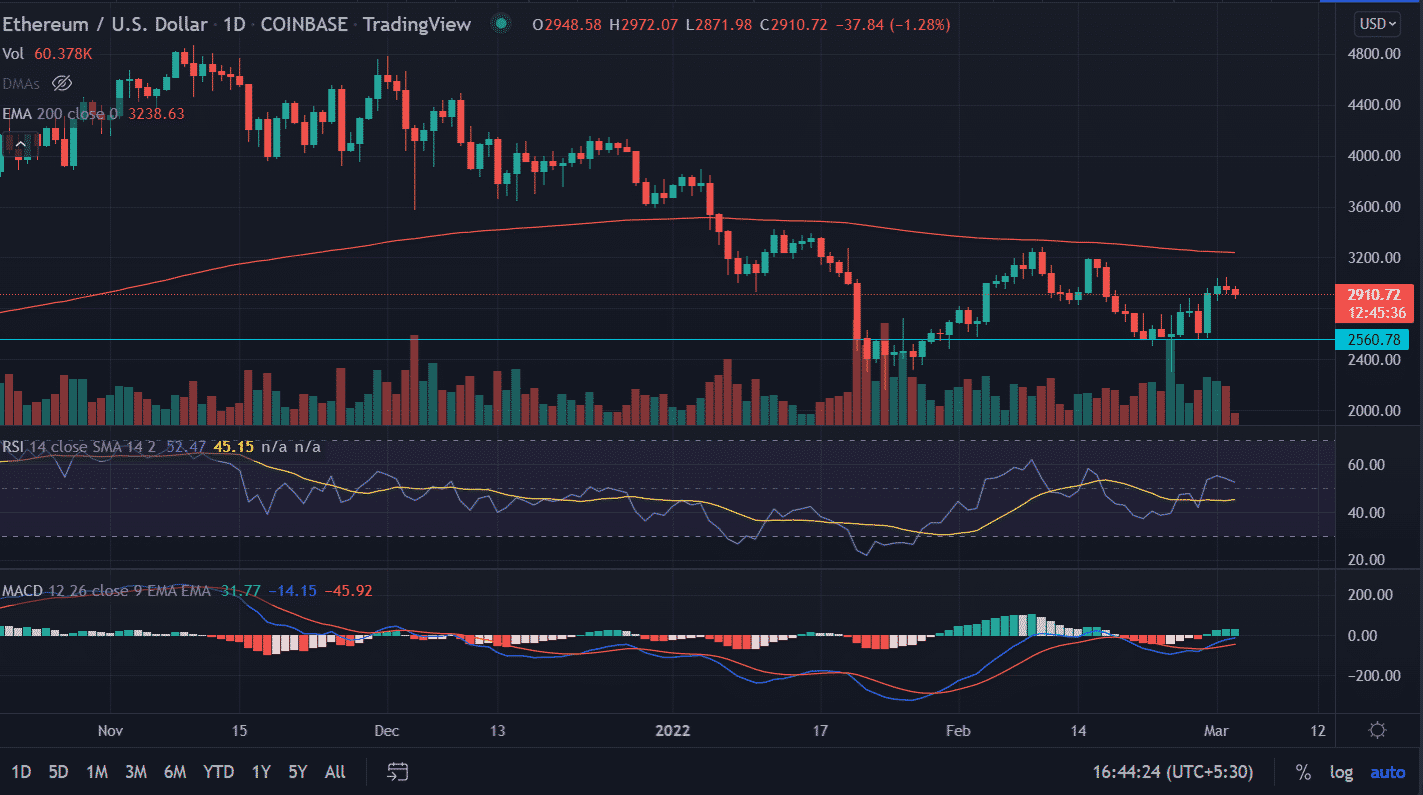
Ethereum (ETH) price finds it difficult to hold the critical $3,000 level as ETH fell more than 4% since it made high on Wednesday. The current price action shows bulls are not willing or interested in keeping up the upside momentum in the asset.
The formation of a ‘Doji’ candlestick in the previous session followed by red candlesticks is a perfect bearish ‘Evening star’ pattern. The Evening star pattern is formed when the price is in an uptrend with receding upside momentum or lack of confidence among investors.
Now, a decisive close below the $2,800 mark will trigger a fresh round of selling in the pair. The immediate downside target could be found at the horizontal support zone of $2,560.78.
Next, the price could revisit February lows placed at $2,300.
Alternatively, a resurgence in buying pressure would negate the bearish outlook at least in the short term, with the first resistance hurdle at the previous session’s high of $3,045.00. Further, if the bullish momentum continued then bulls will take out the 200-EMA (Exponential Moving Average) at $3,235.
Technical indicators:
RSI: The Daily Relative Strength Index (RSI) trades at 50 with a bearish tilt. Any downtick in the indicator would result in the continuation of the downside momentum.
MACD: The Moving Average Convergence Divergence (MACD) although hovers below midline but remains mildly bullish.

Why Trust CoinGape
CoinGape has covered the cryptocurrency industry since 2017, aiming to provide informative insights Read more…to our readers. Our journal analysts bring years of experience in market analysis and blockchain technology to ensure factual accuracy and balanced reporting. By following our Editorial Policy, our writers verify every source, fact-check each story, rely on reputable sources, and attribute quotes and media correctly. We also follow a rigorous Review Methodology when evaluating exchanges and tools. From emerging blockchain projects and coin launches to industry events and technical developments, we cover all facets of the digital asset space with unwavering commitment to timely, relevant information.
Related Articles


- Bitget Cuts Stock Perps Fees to Zero for Makers Ahead of Earnings Season, Expanding Access Across Markets
- South Korea’s Bithumb Probed by Lawmakers as CEO Blames Glitch for $40B Bitcoin Error
- Robinhood Launches Public Testnet for Ethereum Layer 2 ‘Robinhood Chain’
- Binance Founder CZ Joins Scaramucci, Saylor to Confirm Crypto & Bitcoin Buying, “Not Selling”
- Crypto Market Bill Nears Resolution as Ripple CLO Signals Compromise After Key Meeting
- Ripple Price Prediction As Goldman Sachs Discloses Crypto Exposure Including XRP
- Bitcoin Price Analysis Ahead of US NFP Data, Inflation Report, White House Crypto Summit
- Ethereum Price Outlook As Vitalik Dumps ETH While Wall Street Accumulates
- XRP Price Prediction Ahead of White House Meeting That Could Fuel Clarity Act Hopes
- Cardano Price Prediction as Bitcoin Stuggles Around $70k
- Bitcoin Price at Risk of Falling to $60k as Goldman Sachs Issues Major Warning on US Stocks


