
Ethereum (ETH) Price Prediction: ETH face 17% Upside Risk Amid Fed Testimony


Ethereum (ETH) price remains submissive in today’s session following two consecutive higher sessions. It seems price took a breather before taking a leap toward the swing highs of $3,057.81. Market uncertainty and volatility rule the cryptomarkets as investors await two key events.
- Ethereum’s (ETH) price remains on edge on Wednesday.
- ETH is expected to rally 17% as investors go for bargain hunting.
- A close below $2,800 will invalidate the bullish case.
Market participants will be closely watching for Federal Reserve Chairman Jerome Powell as he prepares for his two-day testimony before Congress today. Secondly, the second round of negotiations between Russia-Ukraine will dictate the market mood.
At the time of writing, ETH/USD is trading at $2,939.28, down 1.16% for the day. As per CoinMarketCap, the second-largest cryptocurrency by market cap holds the 24-hour trading volume at $18,967,477,022 with a loss of 11%.
In the latest update, the Ethereum team has announced a reduction in gas fees due to the ongoing Serenity upgrade, virtually good news for the blockchain. But ETH remains largely unfazed by the development.
ETH looks for bullish continuation
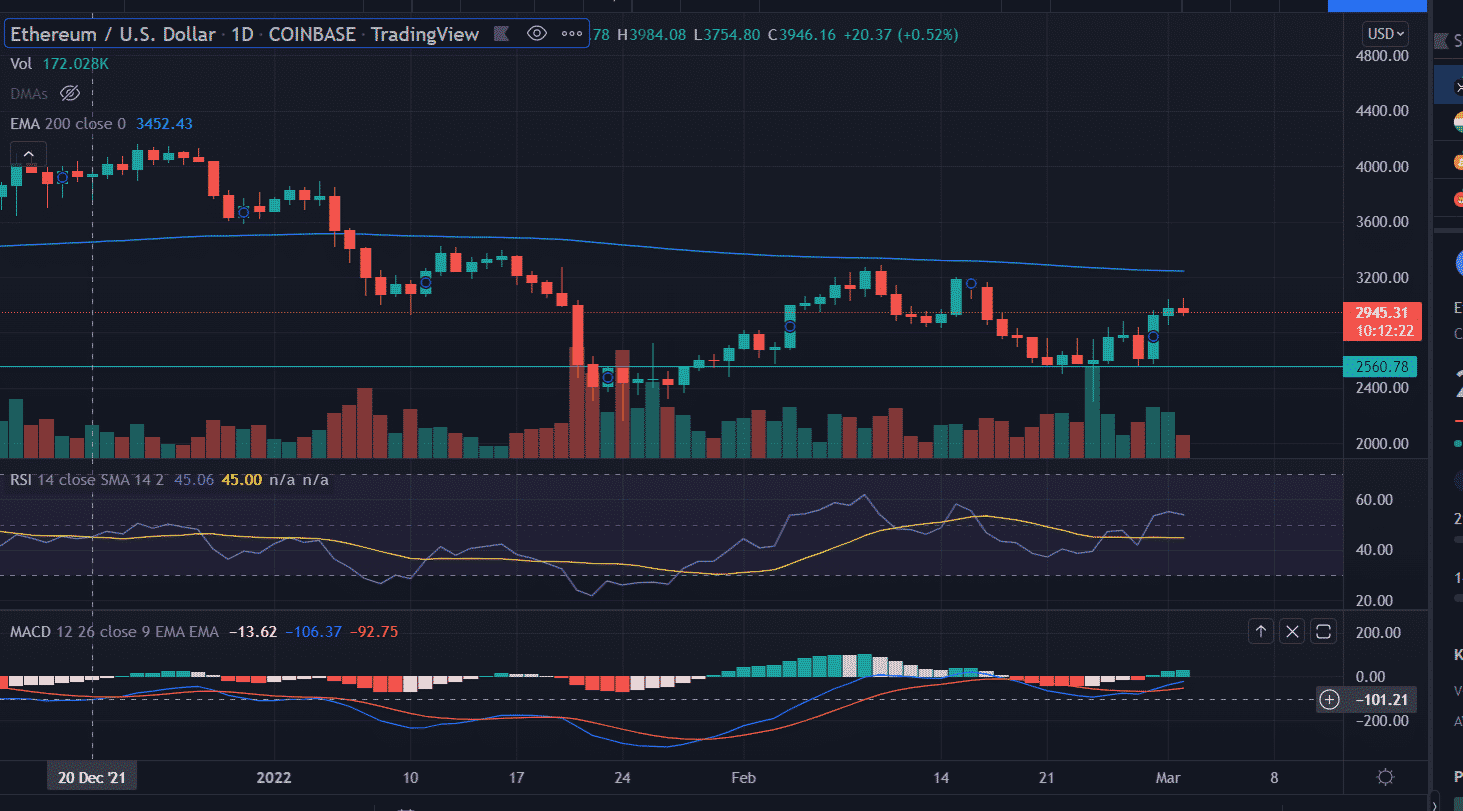
On the daily chart, Ethereum (ETH) price retraced nearly 30% from the swing highs of $3,284.75 and tested February lows at $2,300. Investors respected the demand zone extending from $2,159 and $2,300 as buying emerges near the mentioned levels.
Now, if the price sustains above the session’s high then next it would take out the critical 200-day EMA (Exponential Moving Average) at $3,246.
Furthermore, an acceptance above the mentioned moving average would aim for the January 12 highs of $3,420.08.
On the other side, a break below Tuesday’s low will initiate some fresh round of selling in the asset. The immediate downside target could be found around the horizontal support zone of $2,560.78.
Technical indicators:
RSI: The Daily Relative Strength Index (RSI) reads at 53 above the average line.
MACD: The Moving Average Convergence Divergence (MACD) hovers below the midline but with a bullish bias.

Why Trust CoinGape
CoinGape has covered the cryptocurrency industry since 2017, aiming to provide informative insights Read more…to our readers. Our journal analysts bring years of experience in market analysis and blockchain technology to ensure factual accuracy and balanced reporting. By following our Editorial Policy, our writers verify every source, fact-check each story, rely on reputable sources, and attribute quotes and media correctly. We also follow a rigorous Review Methodology when evaluating exchanges and tools. From emerging blockchain projects and coin launches to industry events and technical developments, we cover all facets of the digital asset space with unwavering commitment to timely, relevant information.


- Monero Privacy Demand Hits Record Highs: How GhostSwap Is Meeting the BTC to XMR Surge
- Goldman Sachs Defies Oil Surge with Bold 2026 Fed Rate Cut Forecast
- Bitcoin Risks Fall as US-Israel Strikes Iran’s Energy Facilities Despite Trump’s 5-Day Pause
- Crypto Leaders Call Stablecoin Yield Text Language in CLARITY Act as “Restrictive”
- FUNToken 2026-2027 Roadmap: Gaming Launch, AI Agent Economy & Tokenized Pokémon cards Collectibles
- Bittensor (TAO) Price Soars 80% MoM Outperforming Bitcoin- Is It A Good Time to Buy?
- Top Factors Behind Shiba Inu (SHIB) Price Surging Today
- Gold Vs BTC: Bitcoin Outperforms Gold by 23% – Is $75K Next Amid Trump’s Five Day Pause
- Crypto Stocks to Watch As Trump Issues 48-Hour Iran Ultimatum- CRCL, COIN, and MSTR Price Analysis
- XRP Price Prediction Ahead of March 27 SEC Spot ETF Decision
- Will Solana Price Recover This Week Amid New SEC/CFTC Crypto Rules?


