Ethereum Price Today: Will ETH Hit $4k First or $2k?

Highlights
- Ethereum price is down 0.50% today as it trades around $3,087.
- ETH could revisit $4k if it can overcome $3,352 to $3,497 hurdle.
- A breakdown of $2,885 could result in a steep correction for Ether.
Ethereum (ETH) price today trades at $3,073.6 as of 11 PM. Ether prices hit a daily high of $3,150.2 today after rising -1.34% on December 20.
Ethereum Price is Up Today: Why?
The Ethereum price trades at $3,073.6 after recovering nearly 4% from the daily low of $3034.84. This uptick is in line with Bitcoin’s 0.90% gain today. If this trend keeps up the New York trading session could propel the value of ETH higher.
*Ethereum price updated as of 11 PM.
Ethereum’s innovative smart contract technology has made it a standout altcoin since its inception in 2015. Continuous major network upgrades ensure Ethereum stays ahead in smart contract innovation. The latest upgrade, Cancun, launched on March 13, 2024.
Ethereum Price History
The year-to-date (YTD) performance of ETH is 8.17%, after dropping form double digits at the start of the week. As of December 20, 2024, if you invested $10,000 in ETH on January 1, 2024, your portfolio, after 299 days, would be worth nearly $10,817. Regardless of Ethereum’s lackluster performance its market capitalization stands at $370.1 billion.
Ethereum Market Cap: The Second-Largest Cryptocurrency
Ethereum ranks second in market capitalization, valued at $370.1 billion, after Bitcoin’s $1.85 trillion. Together, they comprise 83% of the crypto market.
- Solana (SOL): $112 billion
- Ripple (XRP): $63 billion
Despite this recent downtick and recovery, the 24-hour trading volume of Ethereum is $31.3 billion.
Ethereum Trading Volume
The 24-hour trading volume of Ethereum is $31.3 billion. Binance is the largest contributer to this trading volume – about 11% is contributed by spot trading and nearly 40% from futures trading. Exchanges like OKX, Bitget, ByBit follow Binance.
Ethereum Blockchain Upgrade to PoS
The London hard fork is a significant Ethereum blockchain upgrade. It changed the network from Proof-of-Work (PoW) to Proof-of-Stake (PoS). Ethereum co-founder Vitalik Buterin recently shared his thoughts on X (formerly Twitter). He explained how Proof-of-Stake (PoS) is more decentralized than Proof-of-Work (PoW).
Ethereum Blockchain Upgrades in The Last 5 Years
Here are some of the critical upgrades in the past 5 years that have shaped and kept Ethereum as the second-largest crypto by market capitalization.
2024
- Cancun-Deneb (“Dencun”)
2023
- Shanghai-Capella (“Shapella”)
2022
- Paris (The Merge)
- Bellatrix
- Gray Glacier
2021
- Arrow Glacier
- Altair
- London
- Berlin
2020
- Beacon Chain genesis
- Staking deposit contract deployed
- Muir Glacier
Influence of ETH Gas on Ethereum Price
Ethereum’s upgrade aims to solve the blockchain trilemma: balancing decentralization, security, and scalability. The switch to Proof-of-Stake (PoS) enhanced these aspects. Post-upgrade, Ethereum’s transaction fees (gas fees) plummeted, drawing more investors. Gas fees are like taxes, measured in Gwei, required for secure transactions.
As of December 20, the gas fee for a transaction on the ETH network as of 11 PM is 9.825 Gwei.
When Ethereum’s on-chain value grows, presenting opportunities, investors flock, driving gas fees up. This typically occurs during market upswings, peaking at all-time highs.
Ethereum Price Prediction & Trends
Despite crypto’s bullish outlook Ethereum price performance remains lackluster especially when comparing to top altcoins. Perhaps, if Bitcoin price overcomes the $100K hurdle, ETH could trigger a massive rally.
Ethereum Price Outlook For Next Week
| Date | Price | Change |
|---|---|---|
| December 20, 2025 | 2944.64 | -0.4% |
| December 21, 2025 | 2977.66 | 0.71% |
| December 22, 2025 | 3041.27 | 2.86% |
| December 23, 2025 | 3165.26 | 7.06% |
| December 24, 2025 | 3247.04 | 9.82% |
| December 25, 2025 | 3306.90 | 11.85% |
| December 26, 2025 | 3215.20 | 8.75% |
| December 27, 2025 | 3164.29 | 7.03% |
| December 28, 2025 | 3190.66 | 7.92% |
| December 29, 2025 | 3287.66 | 11.2% |
| December 30, 2025 | 3416.19 | 15.55% |
| December 31, 2025 | 3467.87 | 17.29% |
| January 01, 2026 | 3512.00 | 18.79% |
| January 02, 2026 | 3542.42 | 19.81% |
| January 03, 2026 | 3524.86 | 19.22% |
| January 04, 2026 | 3486.05 | 17.91% |
| January 05, 2026 | 3453.81 | 16.82% |
| January 06, 2026 | 3393.56 | 14.78% |
| January 07, 2026 | 3284.31 | 11.08% |
| January 08, 2026 | 3165.31 | 7.06% |
| January 09, 2026 | 3047.76 | 3.08% |
| January 10, 2026 | 3078.82 | 4.13% |
| January 11, 2026 | 3091.20 | 4.55% |
| January 12, 2026 | 3072.18 | 3.91% |
| January 13, 2026 | 3076.79 | 4.07% |
| January 14, 2026 | 3092.43 | 4.59% |
| January 15, 2026 | 3135.98 | 6.07% |
| January 16, 2026 | 3189.43 | 7.88% |
| January 17, 2026 | 3258.89 | 10.22% |
| January 18, 2026 | 3290.22 | 11.28% |
Based on CoinGagpe’s Ethereum price predictions, investors can expect ETH to trade around $,216, a slight uptick in the next week.
Ethereum Price Forecast Between 2025 & 2029
| Month | Minimum Price | Average Price | Maximum Price | Potential ROI |
|---|---|---|---|---|
| January | $2,955.02 | $3,426.71 | $3,190.87 | 8.7% |
| February | $2,965.39 | $3,437.23 | $3,201.31 | 9% |
| March | $2,975.77 | $3,447.75 | $3,211.76 | 9.4% |
| April | $2,986.14 | $3,458.27 | $3,222.21 | 9.7% |
| May | $2,996.52 | $3,468.79 | $3,232.65 | 10.1% |
| June | $3,006.89 | $3,479.31 | $3,243.10 | 10.4% |
| July | $3,017.27 | $3,489.82 | $3,253.55 | 10.8% |
| August | $3,027.64 | $3,500.34 | $3,263.99 | 11.1% |
| September | $3,038.02 | $3,510.86 | $3,274.44 | 11.5% |
| October | $3,048.39 | $3,521.38 | $3,284.89 | 11.9% |
| November | $3,058.77 | $3,531.90 | $3,295.33 | 12.2% |
| December | $3,069.14 | $3,542.42 | $3,305.78 | 12.6% |
| All Time | $3,012.08 | $3,484.56 | $3,248.32 | 10.6% |
| Month | Minimum Price | Average Price | Maximum Price | Potential ROI |
|---|---|---|---|---|
| January | $3,319.21 | $3,772.59 | $3,672.57 | 25.1% |
| February | $3,569.27 | $4,002.75 | $4,039.37 | 37.5% |
| March | $3,819.34 | $4,232.92 | $4,406.16 | 50% |
| April | $4,069.40 | $4,463.08 | $4,772.95 | 62.5% |
| May | $4,319.47 | $4,693.25 | $5,139.75 | 75% |
| June | $4,569.53 | $4,923.41 | $5,506.54 | 87.5% |
| July | $4,819.60 | $5,153.58 | $5,873.33 | 100% |
| August | $5,069.66 | $5,383.74 | $6,240.13 | 112.5% |
| September | $5,319.73 | $5,613.91 | $6,606.92 | 125% |
| October | $5,569.79 | $5,844.07 | $6,973.71 | 137.5% |
| November | $5,819.86 | $6,074.24 | $7,340.51 | 150% |
| December | $6,069.92 | $6,304.40 | $7,707.30 | 162.4% |
| All Time | $4,694.56 | $5,038.49 | $5,689.94 | 93.8% |
| Month | Minimum Price | Average Price | Maximum Price | Potential ROI |
|---|---|---|---|---|
| January | $6,344.39 | $6,580.34 | $7,946.61 | 170.6% |
| February | $6,618.86 | $6,856.29 | $8,185.92 | 178.7% |
| March | $6,893.33 | $7,132.23 | $8,425.23 | 186.9% |
| April | $7,167.80 | $7,408.18 | $8,664.53 | 195% |
| May | $7,442.27 | $7,684.12 | $8,903.84 | 203.2% |
| June | $7,716.74 | $7,960.07 | $9,143.15 | 211.3% |
| July | $7,991.20 | $8,236.01 | $9,382.46 | 219.5% |
| August | $8,265.67 | $8,511.95 | $9,621.77 | 227.6% |
| September | $8,540.14 | $8,787.90 | $9,861.08 | 235.8% |
| October | $8,814.61 | $9,063.84 | $10,100.38 | 243.9% |
| November | $9,089.08 | $9,339.79 | $10,339.69 | 252.1% |
| December | $9,363.55 | $9,615.73 | $10,579 | 260.2% |
| All Time | $7,853.97 | $8,098.04 | $9,262.80 | 215.4% |
| Month | Minimum Price | Average Price | Maximum Price | Potential ROI |
|---|---|---|---|---|
| January | $9,718.84 | $9,990.09 | $11,037.92 | 275.9% |
| February | $10,074.13 | $10,364.44 | $11,496.83 | 291.5% |
| March | $10,429.41 | $10,738.80 | $11,955.75 | 307.1% |
| April | $10,784.70 | $11,113.15 | $12,414.67 | 322.7% |
| May | $11,139.99 | $11,487.51 | $12,873.58 | 338.4% |
| June | $11,495.28 | $11,861.87 | $13,332.50 | 354% |
| July | $11,850.56 | $12,236.22 | $13,791.42 | 369.6% |
| August | $12,205.85 | $12,610.58 | $14,250.33 | 385.3% |
| September | $12,561.14 | $12,984.93 | $14,709.25 | 400.9% |
| October | $12,916.43 | $13,359.29 | $15,168.17 | 416.5% |
| November | $13,271.71 | $13,733.64 | $15,627.08 | 432.1% |
| December | $13,627 | $14,108 | $16,086 | 447.8% |
| All Time | $11,672.92 | $12,049.04 | $13,561.96 | 361.8% |
| Month | Minimum Price | Average Price | Maximum Price | Potential ROI |
|---|---|---|---|---|
| January | $14,174.08 | $14,673.75 | $16,746.08 | 470.2% |
| February | $14,721.17 | $15,239.50 | $17,406.17 | 492.7% |
| March | $15,268.25 | $15,805.25 | $18,066.25 | 515.2% |
| April | $15,815.33 | $16,371 | $18,726.33 | 537.7% |
| May | $16,362.42 | $16,936.75 | $19,386.42 | 560.1% |
| June | $16,909.50 | $17,502.50 | $20,046.50 | 582.6% |
| July | $17,456.58 | $18,068.25 | $20,706.58 | 605.1% |
| August | $18,003.67 | $18,634 | $21,366.67 | 627.6% |
| September | $18,550.75 | $19,199.75 | $22,026.75 | 650.1% |
| October | $19,097.83 | $19,765.50 | $22,686.83 | 672.5% |
| November | $19,644.92 | $20,331.25 | $23,346.92 | 695% |
| December | $20,192 | $20,897 | $24,007 | 717.5% |
| All Time | $17,183.04 | $17,785.38 | $20,376.54 | 593.9% |
In a long-term outlook between 2025 and 2029, Ethereum price will end its ongoing slump and kickstart a bull rally. Based on Coingape’s forecasts, Ether prices could hover between $2,500 to $4,672.
Ethereum Prices Forecast Between 2030 & 2050
| Month | Minimum Price | Average Price | Maximum Price | Potential ROI |
|---|---|---|---|---|
| January | $21,069.92 | $21,785.83 | $25,081.08 | 754.1% |
| February | $21,947.83 | $22,674.67 | $26,155.17 | 790.6% |
| March | $22,825.75 | $23,563.50 | $27,229.25 | 827.2% |
| April | $23,703.67 | $24,452.33 | $28,303.33 | 863.8% |
| May | $24,581.58 | $25,341.17 | $29,377.42 | 900.4% |
| June | $25,459.50 | $26,230 | $30,451.50 | 936.9% |
| July | $26,337.42 | $27,118.83 | $31,525.58 | 973.5% |
| August | $27,215.33 | $28,007.67 | $32,599.67 | 1010.1% |
| September | $28,093.25 | $28,896.50 | $33,673.75 | 1046.7% |
| October | $28,971.17 | $29,785.33 | $34,747.83 | 1083.2% |
| November | $29,849.08 | $30,674.17 | $35,821.92 | 1119.8% |
| December | $30,727 | $31,563 | $36,896 | 1156.4% |
| All Time | $25,898.46 | $26,674.42 | $30,988.54 | 955.2% |
| Month | Minimum Price | Average Price | Maximum Price | Potential ROI |
|---|---|---|---|---|
| January | $31,819.33 | $32,717.17 | $38,188.67 | 1200.4% |
| February | $32,911.67 | $33,871.33 | $39,481.33 | 1244.4% |
| March | $34,004 | $35,025.50 | $40,774 | 1288.4% |
| April | $35,096.33 | $36,179.67 | $42,066.67 | 1332.5% |
| May | $36,188.67 | $37,333.83 | $43,359.33 | 1376.5% |
| June | $37,281 | $38,488 | $44,652 | 1420.5% |
| July | $38,373.33 | $39,642.17 | $45,944.67 | 1464.5% |
| August | $39,465.67 | $40,796.33 | $47,237.33 | 1508.5% |
| September | $40,558 | $41,950.50 | $48,530 | 1552.5% |
| October | $41,650.33 | $43,104.67 | $49,822.67 | 1596.6% |
| November | $42,742.67 | $44,258.83 | $51,115.33 | 1640.6% |
| December | $43,835 | $45,413 | $52,408 | 1684.6% |
| All Time | $37,827.17 | $39,065.08 | $45,298.33 | 1442.5% |
| Month | Minimum Price | Average Price | Maximum Price | Potential ROI |
|---|---|---|---|---|
| January | $45,654.58 | $47,290.25 | $54,443.25 | 1753.9% |
| February | $47,474.17 | $49,167.50 | $56,478.50 | 1823.2% |
| March | $49,293.75 | $51,044.75 | $58,513.75 | 1892.5% |
| April | $51,113.33 | $52,922 | $60,549 | 1961.8% |
| May | $52,932.92 | $54,799.25 | $62,584.25 | 2031.1% |
| June | $54,752.50 | $56,676.50 | $64,619.50 | 2100.4% |
| July | $56,572.08 | $58,553.75 | $66,654.75 | 2169.7% |
| August | $58,391.67 | $60,431 | $68,690 | 2239% |
| September | $60,211.25 | $62,308.25 | $70,725.25 | 2308.3% |
| October | $62,030.83 | $64,185.50 | $72,760.50 | 2377.6% |
| November | $63,850.42 | $66,062.75 | $74,795.75 | 2446.9% |
| December | $65,670 | $67,940 | $76,831 | 2516.2% |
| All Time | $55,662.29 | $57,615.13 | $65,637.13 | 2135.1% |
| Month | Minimum Price | Average Price | Maximum Price | Potential ROI |
|---|---|---|---|---|
| January | $68,117.75 | $70,425.08 | $79,901.08 | 2620.8% |
| February | $70,565.50 | $72,910.17 | $82,971.17 | 2725.3% |
| March | $73,013.25 | $75,395.25 | $86,041.25 | 2829.9% |
| April | $75,461 | $77,880.33 | $89,111.33 | 2934.4% |
| May | $77,908.75 | $80,365.42 | $92,181.42 | 3039% |
| June | $80,356.50 | $82,850.50 | $95,251.50 | 3143.5% |
| July | $82,804.25 | $85,335.58 | $98,321.58 | 3248% |
| August | $85,252 | $87,820.67 | $101,391.67 | 3352.6% |
| September | $87,699.75 | $90,305.75 | $104,461.75 | 3457.1% |
| October | $90,147.50 | $92,790.83 | $107,531.83 | 3561.7% |
| November | $92,595.25 | $95,275.92 | $110,601.92 | 3666.2% |
| December | $95,043 | $97,761 | $113,672 | 3770.8% |
| All Time | $81,580.38 | $84,093.04 | $96,786.54 | 3195.8% |
| Month | Minimum Price | Average Price | Maximum Price | Potential ROI |
|---|---|---|---|---|
| January | $98,039.42 | $101,590 | $117,397.08 | 3897.6% |
| February | $101,035.83 | $105,419 | $121,122.17 | 4024.4% |
| March | $104,032.25 | $109,248 | $124,847.25 | 4151.3% |
| April | $107,028.67 | $113,077 | $128,572.33 | 4278.1% |
| May | $110,025.08 | $116,906 | $132,297.42 | 4405% |
| June | $113,021.50 | $120,735 | $136,022.50 | 4531.8% |
| July | $116,017.92 | $124,564 | $139,747.58 | 4658.7% |
| August | $119,014.33 | $128,393 | $143,472.67 | 4785.5% |
| September | $122,010.75 | $132,222 | $147,197.75 | 4912.4% |
| October | $125,007.17 | $136,051 | $150,922.83 | 5039.2% |
| November | $128,003.58 | $139,880 | $154,647.92 | 5166.1% |
| December | $131,000 | $143,709 | $158,373 | 5292.9% |
| All Time | $114,519.71 | $122,649.50 | $137,885.04 | 4595.3% |
| Month | Minimum Price | Average Price | Maximum Price | Potential ROI |
|---|---|---|---|---|
| January | $135,154.83 | $147,293.58 | $161,713.17 | 5406.6% |
| February | $139,309.67 | $150,878.17 | $165,053.33 | 5520.4% |
| March | $143,464.50 | $154,462.75 | $168,393.50 | 5634.1% |
| April | $147,619.33 | $158,047.33 | $171,733.67 | 5747.9% |
| May | $151,774.17 | $161,631.92 | $175,073.83 | 5861.6% |
| June | $155,929 | $165,216.50 | $178,414 | 5975.3% |
| July | $160,083.83 | $168,801.08 | $181,754.17 | 6089.1% |
| August | $164,238.67 | $172,385.67 | $185,094.33 | 6202.8% |
| September | $168,393.50 | $175,970.25 | $188,434.50 | 6316.6% |
| October | $172,548.33 | $179,554.83 | $191,774.67 | 6430.3% |
| November | $176,703.17 | $183,139.42 | $195,114.83 | 6544% |
| December | $180,858 | $186,724 | $198,455 | 6657.8% |
| All Time | $158,006.42 | $167,008.79 | $180,084.08 | 6032.2% |
Betweem 2023 and 2050, Ethereum price will most likely follow the bullish outlook and aim for the six-digit territory. The highest price of Ether in 2050 based on CoinGape forecasts is $126,482.21
Will Ethererum Rally to $4K or Crash to $2K First?
After a 46% rally in just eight days, Ethereum price is likely to correct as volatility decreases. Many investors are likely to book profits while sidelined buyers wait for a retracement to find a better entry price. Moreoever, the uptrend tagged the $3,352 to $3,497 resistance zone and is currently showing weakness. As a result, the next logical outlook for ETH is a pullback.
The immediate support level at $2,886 is where sidelined buyers could be waiting to deploy captial. In general, the $3,000 to $2,820 zone is a good place to be a buyer. If the overall crypto outlook remains bullish, then BTC should climb to new highs and ETH should follow suit.
In such a case, ETH price should see a strong spike in buying pressure aound $3,000 that should propel it to revisit the $3,352 to $3,497 resistance zone. A breakout should send ETH to the next key psychological level of $4,000.
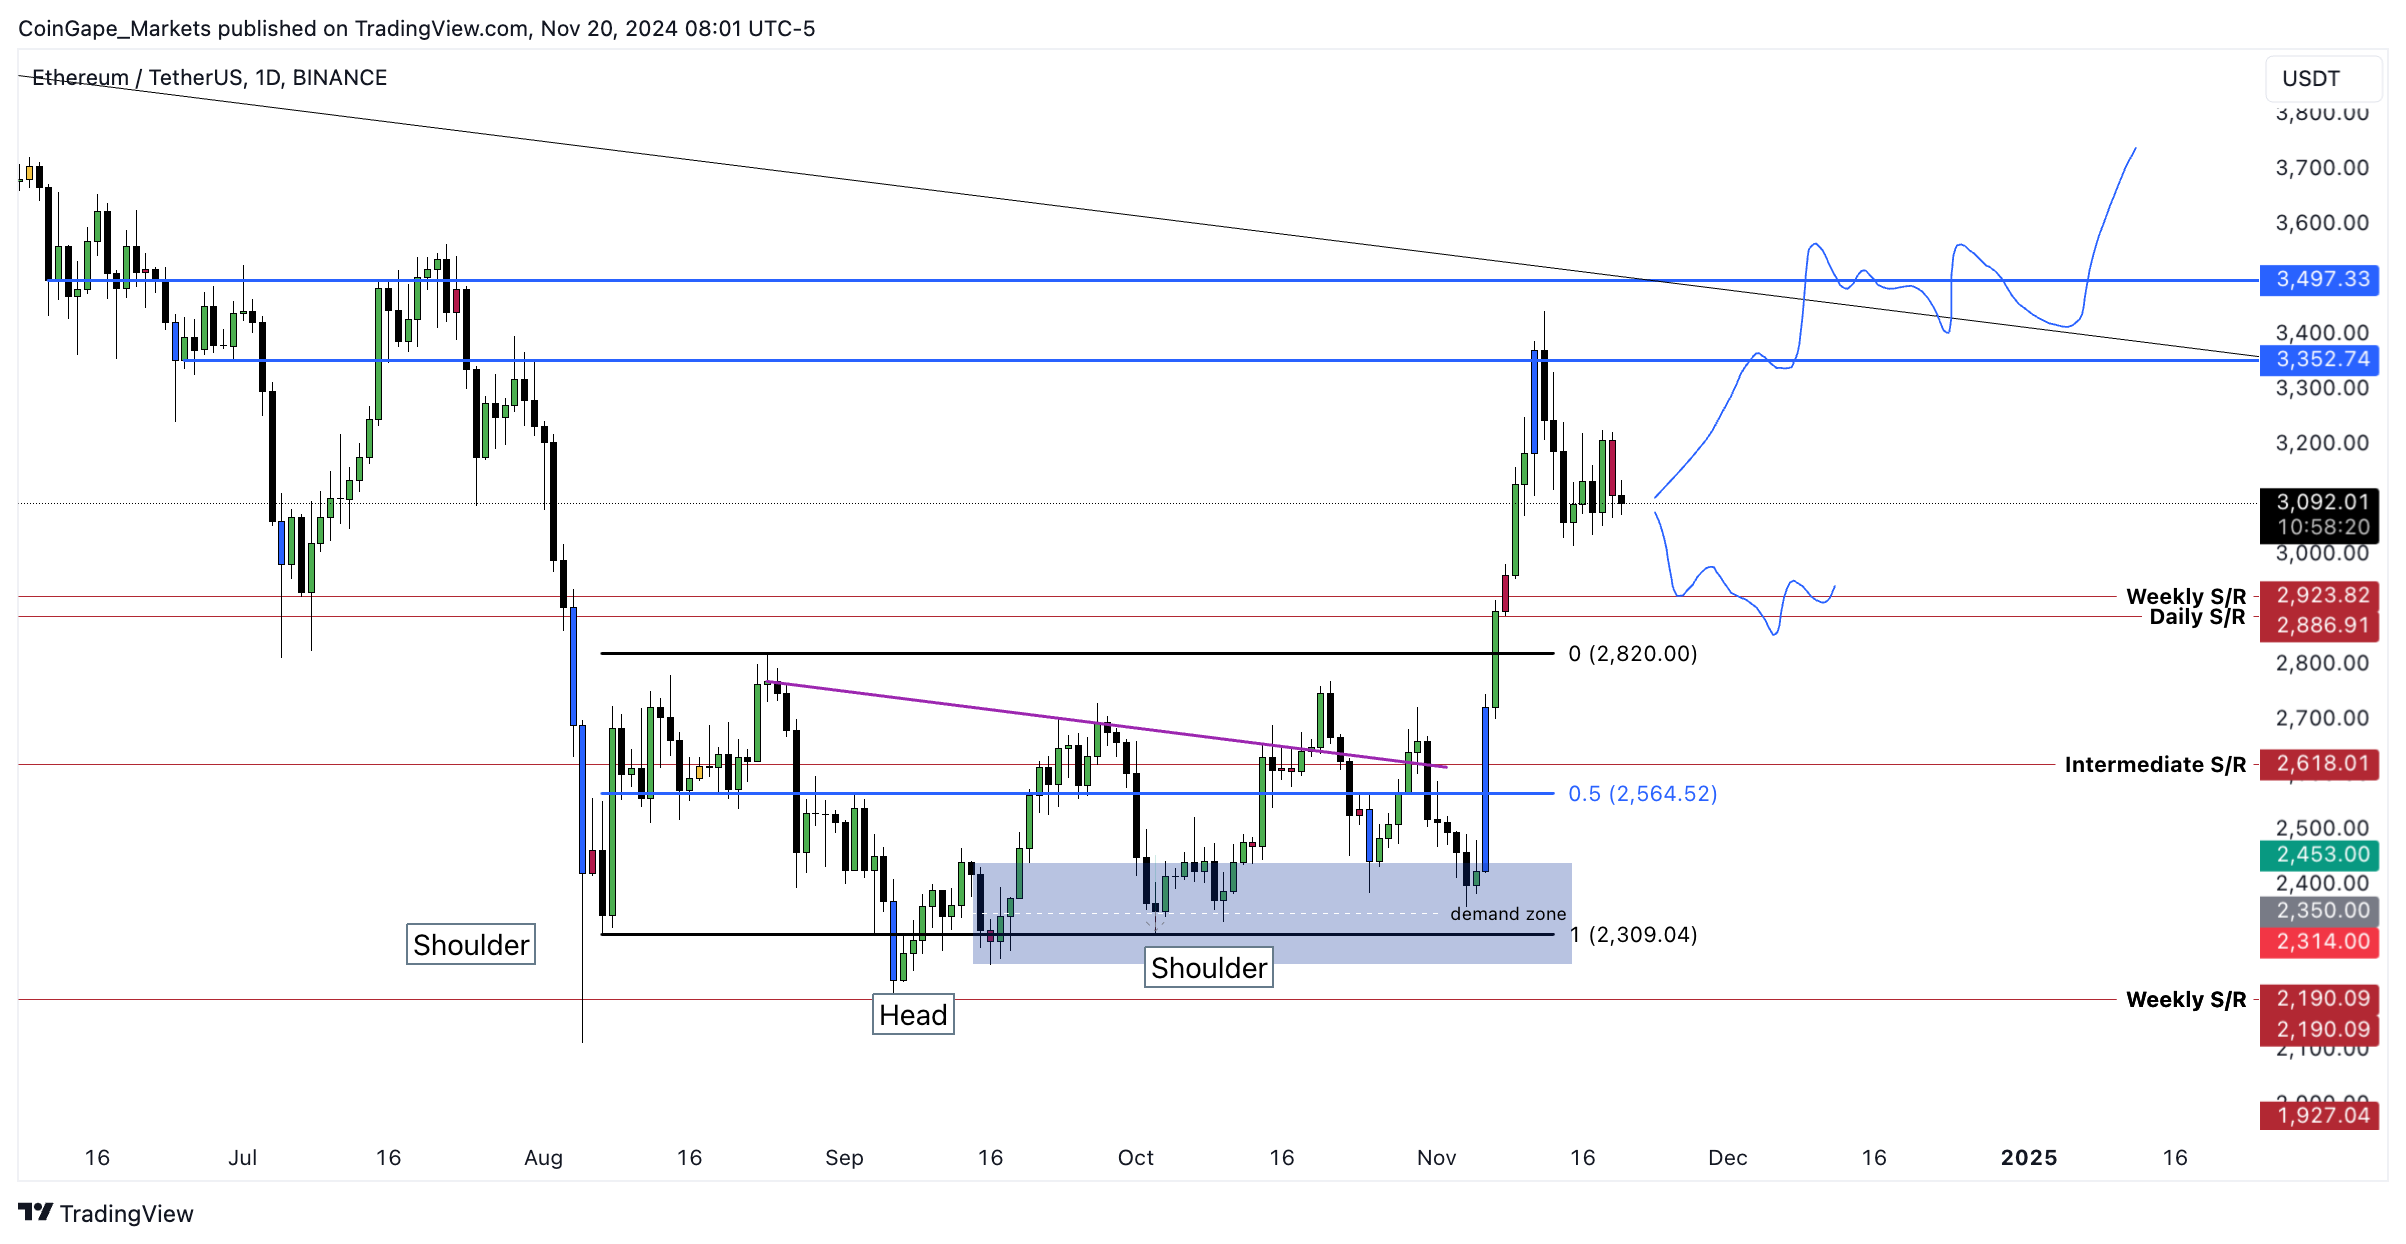
On the other hand, if Ethereum price fails to hold above $2,829, it would signal weakness. Such a development could invite a spike in selling pressure that could knock ETH down by 9% to revisit the range’s midpoint at $2,564. In worst case scenario, Ether could revisit the range low at $2,309.
Recent Posts
- Price Analysis
Will Solana Price Hit $150 as Mangocueticals Partners With Cube Group on $100M SOL Treasury?
Solana price remains a focal point as it responds to both institutional alignment and shifting…
- Price Analysis
SUI Price Forecast After Bitwise Filed for SUI ETF With U.S. SEC – Is $3 Next?
SUI price remains positioned at a critical intersection of regulatory positioning and technical structure. Recent…
- Price Analysis
Bitcoin Price Alarming Pattern Points to a Dip to $80k as $2.7b Options Expires Today
Bitcoin price rebounded by 3% today, Dec. 19, reaching a high of $87,960. This rise…
- Price Analysis
Dogecoin Price Prediction Points to $0.20 Rebound as Coinbase Launches Regulated DOGE Futures
Dogecoin price has gone back to the spotlight as it responds to the growing derivatives…
- Price Analysis
Pi Coin Price Prediction as Expert Warns Bitcoin May Hit $70k After BoJ Rate Hike
Pi Coin price rose by 1.05% today, Dec. 18, mirroring the performance of Bitcoin and…
- Price Analysis
Cardano Price Outlook: Will the NIGHT Token Demand Surge Trigger a Rebound?
Cardano price has entered a decisive phase as NIGHT token liquidity rotation intersects with structural…