Ethereum Price Analysis: Bullish Pattern Sets the $ETH Price for 15% Rally


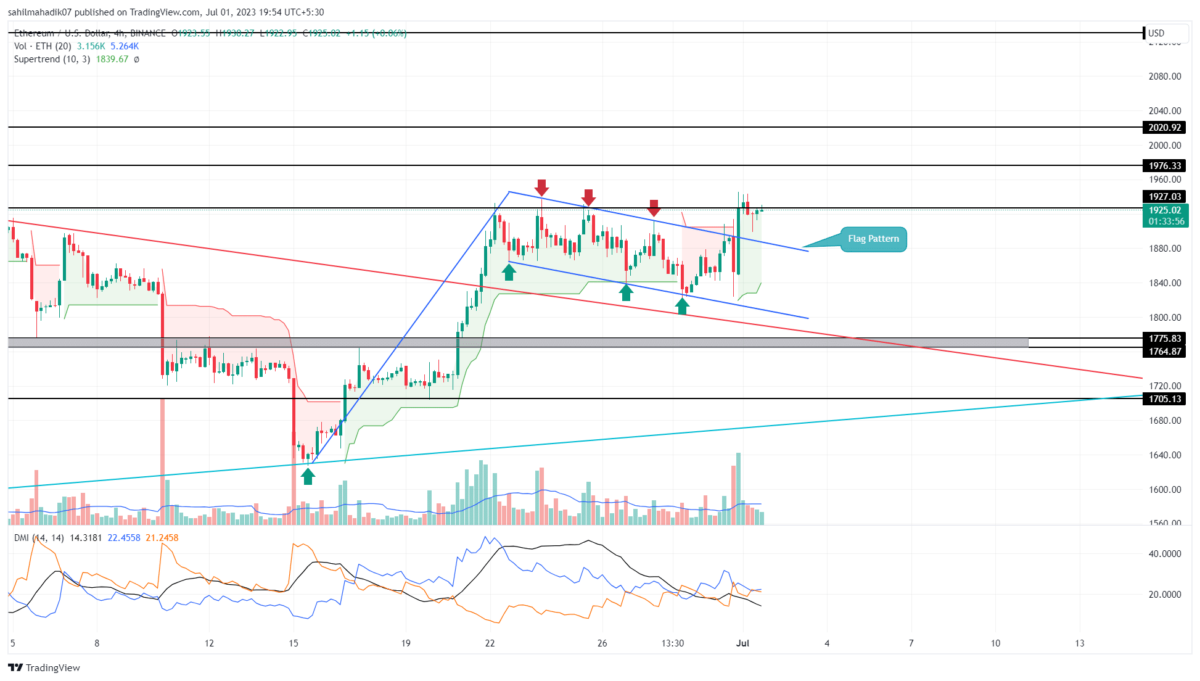
Ethereum Price Analysis: After a week-long of correction, the Ethereum price gave a decisive breakout from the downsloping resistance trendline of the flag pattern. This breakout backed by a spike in trading volume reflects the recuperated bullish momentum and the high possibility for the coin price to reclaim higher ground. Here’s how completing the chart pattern could prolong the bullish rally in ETH price.
Ethereum Price Daily Chart
- A bullish breakout from the resistance trendline set the ETH price for a prolonged rally to $2212
- A possible breakdown below $1837 may set the coin’s market value by 4%
- The intraday trading volume in Ether is $7.5 Billion, indicating a 24% gain.
 Source- Tradingview
In theory, the Flag patterns are formed in an ongoing uptrend to provide buyers with a break period and stabilize the price action. A breakout above the pattern’s resistance trendline signals uptrend continuation and offers traders the opportunity to enter long trades.
Under the influence of this pattern, there are two potential targets for the Ethereum price. The first is the distance between the flag trendlines measured from the breakout point, and the second is the pole distance.
Therefore, with sustained buying, the ETH price could see a minimum growth of $1976 and a max rally of $2212.
Will Ethereum Price Prolong Bullish Recovery?
By the press time, the Ethereum price traded at $1926 with an intraday loss of 0.37%. However, the red candle today could be retested to flag a breakout, checking the sustainability of coin prices at higher levels. The long-lower price rejection candle indicates the buyers obtained suitable support from breached resistance, which could also assist them to rise above the $2000 mark.
- Supertrend: The Supertrend indicator converted back to green film indicates a positive trend sentiment among traders.
- Directional Movement Index: A bullish crossover between the DI+ slope(blue) and the DI- line(orange) reflects increasing buying pressure in the market.

Why Trust CoinGape
CoinGape has covered the cryptocurrency industry since 2017, aiming to provide informative insights Read more…to our readers. Our journal analysts bring years of experience in market analysis and blockchain technology to ensure factual accuracy and balanced reporting. By following our Editorial Policy, our writers verify every source, fact-check each story, rely on reputable sources, and attribute quotes and media correctly. We also follow a rigorous Review Methodology when evaluating exchanges and tools. From emerging blockchain projects and coin launches to industry events and technical developments, we cover all facets of the digital asset space with unwavering commitment to timely, relevant information.
Related Articles


- Will Bitcoin Crash Again as ‘Trump Insider’ Whale Dumps 6,599 BTC
- XRP News: Ripple’s RLUSD Gets Boost as CFTC Expands Approved Tokenized Collateral
- Crypto Markets Brace as Another Partial U.S. Government Shutdown Looms Next Week
- $40B Bitcoin Airdrop Error: Bithumb to Reimburse Customer Losses After BTC Crash To $55k
- ETH Price Fears Major Crash As Trend Research Deposits $1.8B Ethereum to Binance
- Cardano Price Prediction as Midnight Token Soars 15%
- Bitcoin and XRP Price Outlook Ahead of Crypto Market Bill Nearing Key Phase on Feb 10th
- Bitcoin Price Prediction as Funding Rate Tumbles Ahead of $2.1B Options Expiry
- Ethereum Price Outlook as Vitalik Buterin Sells $14 Million Worth of ETH: What’s Next for Ether?
- Solana Price at Risk of Crashing Below $50 as Crypto Fear and Greed Index Plunges to 5
- Pi Network Price Prediction Ahead of PI KYC Validator Reward System Launch


