Ethereum Price Analysis: Bullish Pattern Sets the $ETH Price for 15% Rally
Ethereum Price Analysis: After a week-long of correction, the Ethereum price gave a decisive breakout from the downsloping resistance trendline of the flag pattern. This breakout backed by a spike in trading volume reflects the recuperated bullish momentum and the high possibility for the coin price to reclaim higher ground. Here’s how completing the chart pattern could prolong the bullish rally in ETH price.
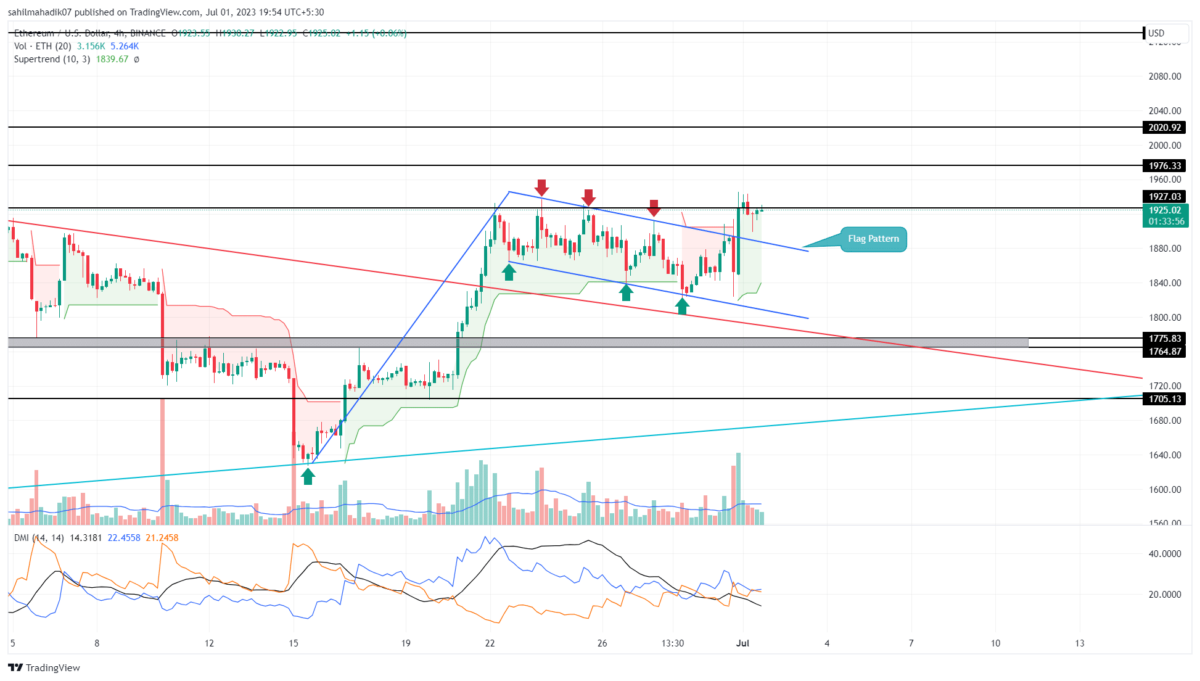
Ethereum Price Daily Chart
- A bullish breakout from the resistance trendline set the ETH price for a prolonged rally to $2212
- A possible breakdown below $1837 may set the coin’s market value by 4%
- The intraday trading volume in Ether is $7.5 Billion, indicating a 24% gain.
In theory, the Flag patterns are formed in an ongoing uptrend to provide buyers with a break period and stabilize the price action. A breakout above the pattern’s resistance trendline signals uptrend continuation and offers traders the opportunity to enter long trades.
Under the influence of this pattern, there are two potential targets for the Ethereum price. The first is the distance between the flag trendlines measured from the breakout point, and the second is the pole distance.
Therefore, with sustained buying, the ETH price could see a minimum growth of $1976 and a max rally of $2212.
Will Ethereum Price Prolong Bullish Recovery?
By the press time, the Ethereum price traded at $1926 with an intraday loss of 0.37%. However, the red candle today could be retested to flag a breakout, checking the sustainability of coin prices at higher levels. The long-lower price rejection candle indicates the buyers obtained suitable support from breached resistance, which could also assist them to rise above the $2000 mark.
- Supertrend: The Supertrend indicator converted back to green film indicates a positive trend sentiment among traders.
- Directional Movement Index: A bullish crossover between the DI+ slope(blue) and the DI- line(orange) reflects increasing buying pressure in the market.
Recent Posts
- Price Analysis
Pi Coin Price Prediction as Expert Warns Bitcoin May Hit $70k After BoJ Rate Hike
Pi Coin price rose by 1.05% today, Dec. 18, mirroring the performance of Bitcoin and…
- Price Analysis
Cardano Price Outlook: Will the NIGHT Token Demand Surge Trigger a Rebound?
Cardano price has entered a decisive phase as NIGHT token liquidity rotation intersects with structural…
- Price Analysis
Will Bitcoin Price Crash to $74K as Japan Eyes Rate Hike on December 19?
Bitcoin price continues to weaken after breaking below its recent consolidation range, now trading within…
- Price Analysis
Bitwise Predicts Solana Price Will Hit New All-Time Highs in 2026
Solana price declined by 4% over the past 24 hours, breaking below the key $130…
- Price Analysis
Bitcoin Price Outlook: Capriole Founder Warns of a Drop Below $50K by 2028
Bitcoin price narratives continue to evolve as long-term downside risks regain attention. Bitcoin price discussions…
- Price Analysis
XRP Price Rare Pattern Points to a Surge to $3 as ETFs Cross $1B Milestone
XRP price dropped by 1.2% today, Dec. 17, continuing a downward trend that started in…