Ethereum Price Analysis: $ETH Bulls Must Break This Price Level To End Correction
With an intraday gain of 1.67%, Ethereum price shows the formation of a bullish candle pattern calling morning star in the daily time frame chart. This reversal candle at the range support of $1789, indicating the buyers continue to defend this level and may extend the current sideway trend. However, a down-slopping trendline poised to hit the ETH price will bring more selling orders into the market and bolster the continuation of the prior retracement phase.
Also Read: Ethereum Price To $1400? Wedge Pattern Sets ETH Price For A Major Correction
Ethereum Price Daily Chart
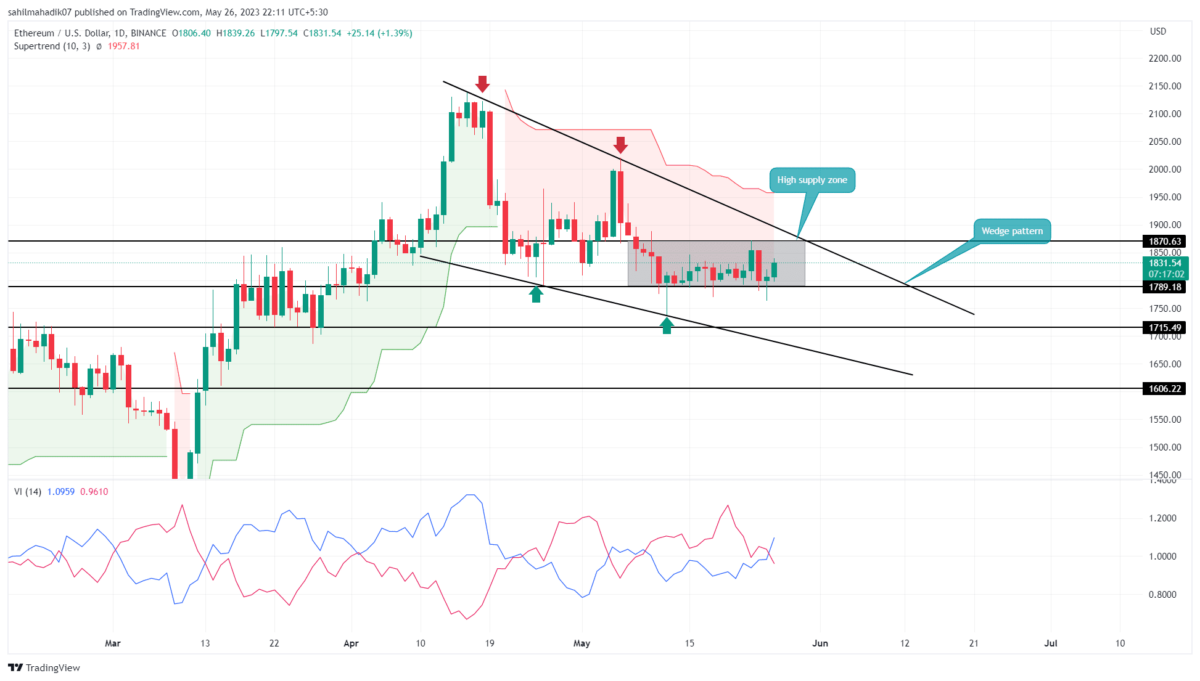
- A potential reversal from the $1870 resistance will intensify the selling pressure on the ETH price
- The ongoing downtrend will continue until the wedge pattern is intact.
- The intraday trading volume in Ether is $5.8 Billion, indicating a 9.5% loss.
A bullish reversal from the $1789 support has set the Ethereum price on an upswing to rechallenge the $1870 barrier. The potential jump could record a short gain of 2%, and showcase another breakout attempt from this two-week consolidation period.
However, the $1870 is accompanied by the dynamic resistance of the falling wedge pattern. This bearish pattern governs the current correction phase in the second largest cryptocurrencies, restricting its growth over the past five weeks.
Thus, a retest to the aforementioned resistance will pour in more selling pressure and likely revert the ETH price lower. Anyhow, a breakdown below the $1789 support with a daily candle closing will drive the price back to $1715 support.
Will Ethereum Price Loss $1700 Support?
A potential reversal from the $1870 resistance will hint at the continuation of the ongoing downtrend in ETH price. The resulting downfall will set this altcoin to make a new lower low at the $1700 mark. However, this support aligned with the 200-day EMA slope won’t give an easy breakdown.
- Supertrend: The red film projected in the daily chart suggests the overall market trend remains bearish
- Vortex Indicator: First bullish crossover between the VI+(blue) and VI-(orange) after two weeks, indicating the ETH price is more likely to rise higher and hit the $1870 barrier.
Recent Posts
- Price Analysis
Cardano Price Outlook: Will the NIGHT Token Demand Surge Trigger a Rebound?
Cardano price has entered a decisive phase as NIGHT token liquidity rotation intersects with structural…
- Price Analysis
Will Bitcoin Crash to $74K as Japan Eyes Rate Hike on December 19?
Bitcoin price continues to weaken after breaking below its recent consolidation range, now trading within…
- Price Analysis
Bitwise Predicts Solana Price Will Hit New All-Time Highs in 2026
Solana price declined by 4% over the past 24 hours, breaking below the key $130…
- Price Analysis
Bitcoin Price Outlook: Capriole Founder Warns of a Drop Below $50K by 2028
Bitcoin price narratives continue to evolve as long-term downside risks regain attention. Bitcoin price discussions…
- Price Analysis
XRP Price Rare Pattern Points to a Surge to $3 as ETFs Cross $1B Milestone
XRP price dropped by 1.2% today, Dec. 17, continuing a downward trend that started in…
- Price Analysis
DOGE Whales Add 138M Coins in 24 Hours: Will Dogecoin Price Rebound Above $0.15?
Dogecoin price traded at $0.1304 on Tuesday, up 1.39% in the last 24 hours.…