Ethereum Price Analysis: Will $ETH Bulls Regain Control at $1845 Support?


Ethereum Price Analysis: The Ethereum price reveals a recent downtrend in response to waning bullish momentum driven by participants of several US-based companies for Spot Bitcoin ETF. As the market leaders Bitcoin and Ethereum experienced a significant downsizing in the past week, the ETH market value tumbled 6% and reached $1845 locally. However, the current sideways movement between $1875 and $1845 indicates a critical range to watch as it can replenish a directional movement back to this altcoin.
Also Read: Bitcoin, Ethereum, USDT Trade At Discount On BinanceUS, Arbitrage Opportunity Or Trap?
Ethereum Price Daily Chart
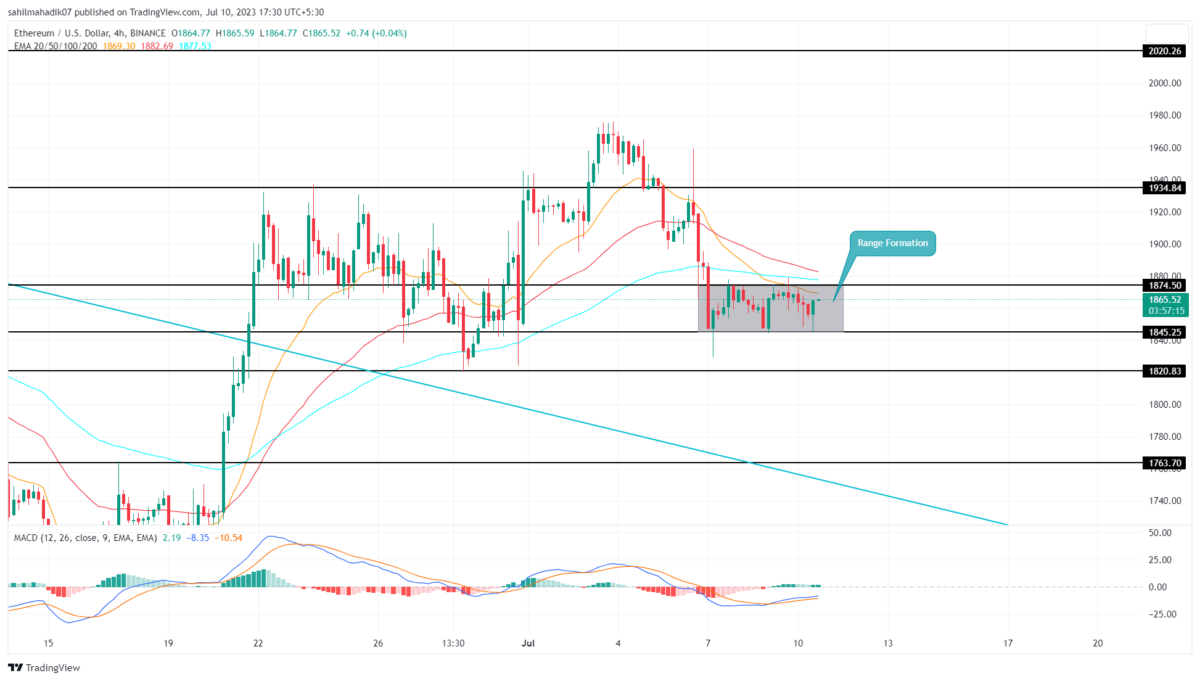
- The Ethereum price showcases a no-trading zone between $1875 and $1845
- The lower price rejection candle at $1845 reflects suitable demand pressure
- The intraday trading volume in Ether is $5.2 Billion, indicating a 32% gain.
 Source- Tradingview
The falling Ethereum price takes a sideways detour and creates a range between $1875 and $1845 horizontal levels. This range could be a temporary halt in the bearish march, allowing sellers to regain their strength.
The bearish pressure on Ether has the potential to intensify if the price breaks below the $1845 support level. Such a breakdown would provide sellers with an opportunity to exert further downward pressure, potentially causing the price to tumble by an additional 7%.
In this scenario, the price may find support around the $1720 demand zone, attracting buyers looking for potential opportunities to enter the market at a lower price point. The $1720 level aligned with a rising support trendline provides an opportunity to accumulate at a dip.
Can ETH Price Rise Back to $1934?
If the Ethereum price manages to sustain above the 1845 support associated with a 32.6% Fibonacci retracement level, the buyers could trigger a breakout above the $1875 resistance level. A breakout above this barrier, with a 4-hour candle closing could signify a shift in the market dynamics. Such a breakthrough would provide an opportunity for buyers to regain control and potentially drive the price toward the $1934 mark.
- Exponential Moving Average: The 4-hour EMAs(20, 50, 100, and 200) moving above the ETH price indicate multiple resistance against potential recovery.
- Moving Average Convergence Divergence: Despite a lower low formation in the MACD indicator, the price action maintaining a higher low indicates the sellers’ attempts are not causing a major effect.

Why Trust CoinGape
CoinGape has covered the cryptocurrency industry since 2017, aiming to provide informative insights Read more…to our readers. Our journal analysts bring years of experience in market analysis and blockchain technology to ensure factual accuracy and balanced reporting. By following our Editorial Policy, our writers verify every source, fact-check each story, rely on reputable sources, and attribute quotes and media correctly. We also follow a rigorous Review Methodology when evaluating exchanges and tools. From emerging blockchain projects and coin launches to industry events and technical developments, we cover all facets of the digital asset space with unwavering commitment to timely, relevant information.

Related Articles


- Ripple CEO Hints Crypto Bill Is Near Deal, Sets April as Approval Timeline
- Wall Street Giant Signals XRP Price ‘Long Winter’ After Cutting Target By 65%
- Shark Tank Kevin O’Leary Warns Bitcoin Crash as Quantum Computing Threats Turns Institutions Cautious
- Japan’s SBI Clears XRP Rumors, Says $4B Stake Is in Ripple Labs Not Tokens
- 63% of Tokenized U.S. Treasuries Now Issued on XRP Ledger: Report
- Bitcoin Price Prediction as Experts Warns of Quantum Risks
- Dogecoin, Shiba Inu, Pepe Coin Price Predictions As BTC Crashes Below $68k
- Ethereum Price Outlook as Harvard Shifts Focus from Bitcoin to ETH ETF
- HOOD and COIN Stock Price Forecast as Expert Predicts Bitcoin Price Crash to $10k
- XRP Price Prediction Ahead of Supreme Court Trump Tariff Ruling
- Crypto Price Prediction For This Week: Dogecoin, Solana and Cardano


