Ethereum Price Analysis: Will $ETH Bulls Regain Control at $1845 Support?
Ethereum Price Analysis: The Ethereum price reveals a recent downtrend in response to waning bullish momentum driven by participants of several US-based companies for Spot Bitcoin ETF. As the market leaders Bitcoin and Ethereum experienced a significant downsizing in the past week, the ETH market value tumbled 6% and reached $1845 locally. However, the current sideways movement between $1875 and $1845 indicates a critical range to watch as it can replenish a directional movement back to this altcoin.
Also Read: Bitcoin, Ethereum, USDT Trade At Discount On BinanceUS, Arbitrage Opportunity Or Trap?
Ethereum Price Daily Chart
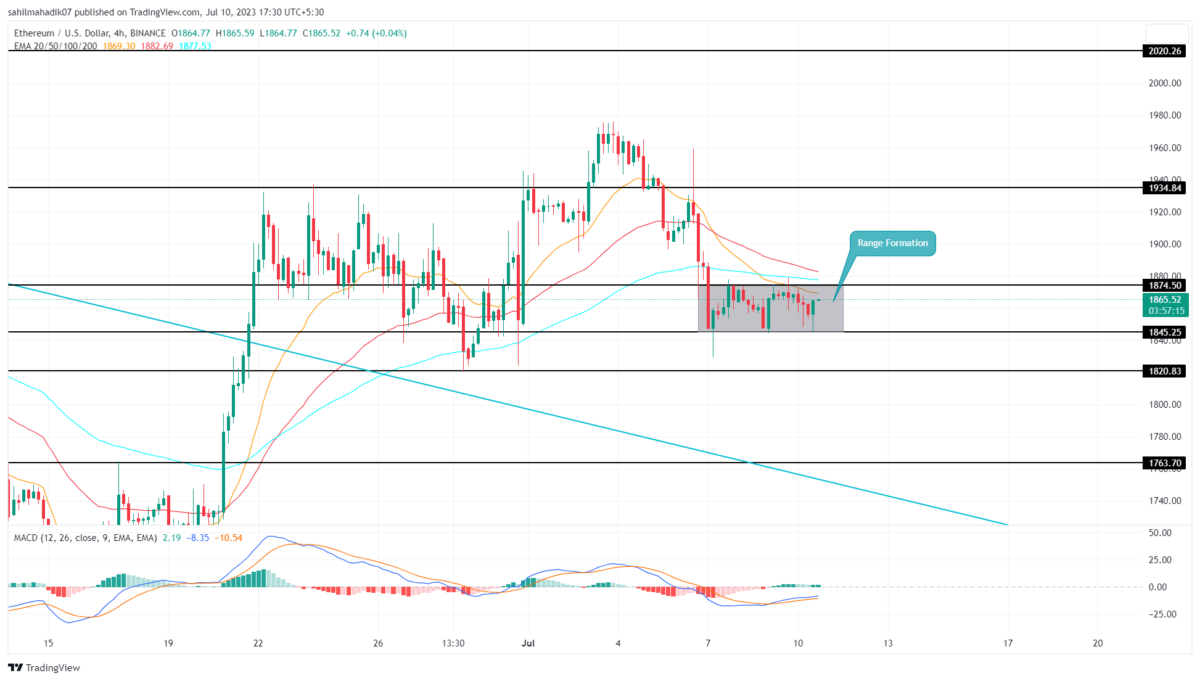
- The Ethereum price showcases a no-trading zone between $1875 and $1845
- The lower price rejection candle at $1845 reflects suitable demand pressure
- The intraday trading volume in Ether is $5.2 Billion, indicating a 32% gain.
The falling Ethereum price takes a sideways detour and creates a range between $1875 and $1845 horizontal levels. This range could be a temporary halt in the bearish march, allowing sellers to regain their strength.
The bearish pressure on Ether has the potential to intensify if the price breaks below the $1845 support level. Such a breakdown would provide sellers with an opportunity to exert further downward pressure, potentially causing the price to tumble by an additional 7%.
In this scenario, the price may find support around the $1720 demand zone, attracting buyers looking for potential opportunities to enter the market at a lower price point. The $1720 level aligned with a rising support trendline provides an opportunity to accumulate at a dip.
Can ETH Price Rise Back to $1934?
If the Ethereum price manages to sustain above the 1845 support associated with a 32.6% Fibonacci retracement level, the buyers could trigger a breakout above the $1875 resistance level. A breakout above this barrier, with a 4-hour candle closing could signify a shift in the market dynamics. Such a breakthrough would provide an opportunity for buyers to regain control and potentially drive the price toward the $1934 mark.
- Exponential Moving Average: The 4-hour EMAs(20, 50, 100, and 200) moving above the ETH price indicate multiple resistance against potential recovery.
- Moving Average Convergence Divergence: Despite a lower low formation in the MACD indicator, the price action maintaining a higher low indicates the sellers’ attempts are not causing a major effect.
Recent Posts
- Price Analysis
SUI Price Forecast After Bitwise Filed for SUI ETF With U.S. SEC – Is $3 Next?
SUI price remains positioned at a critical intersection of regulatory positioning and technical structure. Recent…
- Price Analysis
Bitcoin Price Alarming Pattern Points to a Dip to $80k as $2.7b Options Expires Today
Bitcoin price rebounded by 3% today, Dec. 19, reaching a high of $87,960. This rise…
- Price Analysis
Dogecoin Price Prediction Points to $0.20 Rebound as Coinbase Launches Regulated DOGE Futures
Dogecoin price has gone back to the spotlight as it responds to the growing derivatives…
- Price Analysis
Pi Coin Price Prediction as Expert Warns Bitcoin May Hit $70k After BoJ Rate Hike
Pi Coin price rose by 1.05% today, Dec. 18, mirroring the performance of Bitcoin and…
- Price Analysis
Cardano Price Outlook: Will the NIGHT Token Demand Surge Trigger a Rebound?
Cardano price has entered a decisive phase as NIGHT token liquidity rotation intersects with structural…
- Price Analysis
Will Bitcoin Price Crash to $74K as Japan Eyes Rate Hike on December 19?
Bitcoin price continues to weaken after breaking below its recent consolidation range, now trading within…