Ethereum Price Analysis: Consolidates Below $1,600; Is Time To Accumulate?


Ethereum price analysis portrays a negative trend for the day. The price responded to the shift in the market structure and is currently favoring the bears.
- Ethereum price trades with substantial losses on the first trading day of the week.
- The price could test the liquidity resting below $1,450 amid sustained selling pressure.
- However, a daily close above $1,620 could lead to a recovery rally in ETH.
Ethereum price looks for consolidation
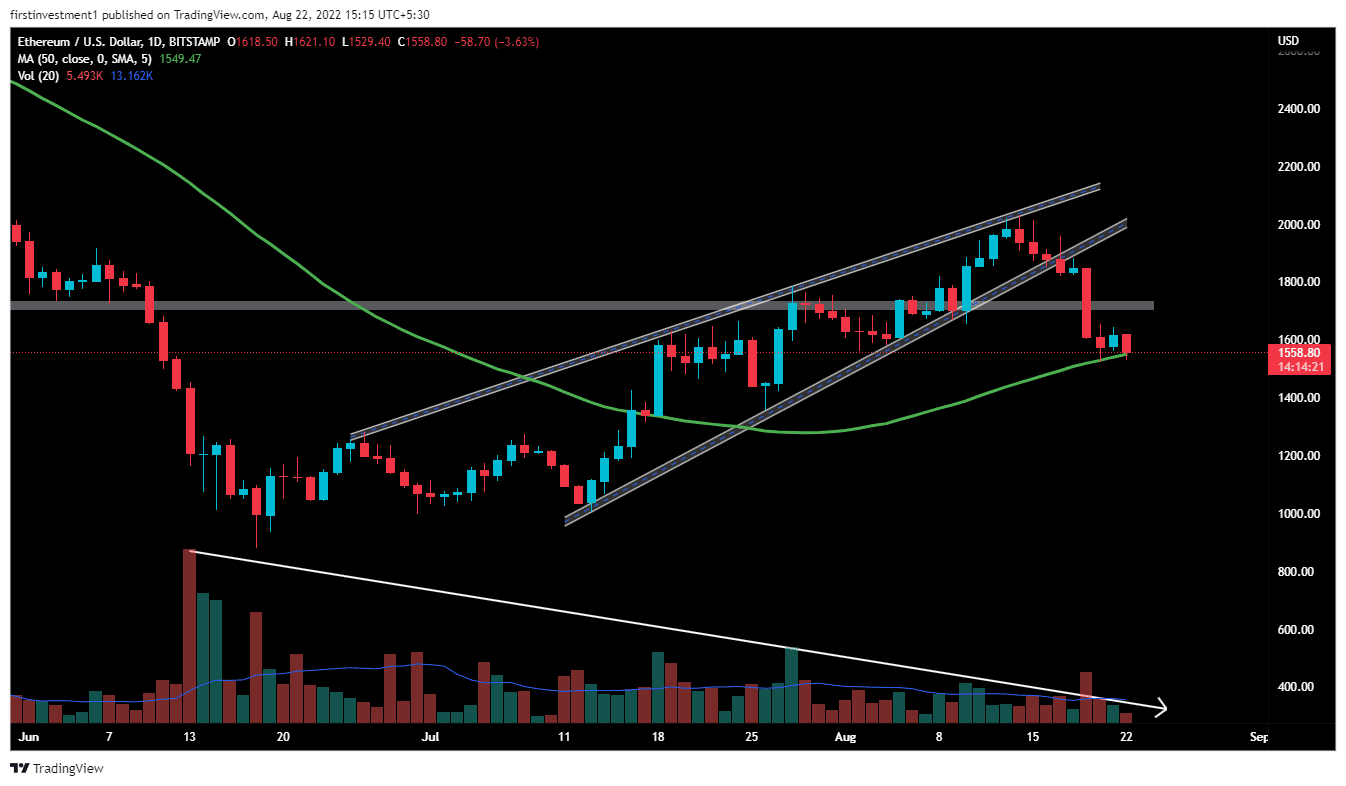
Ethereum price analysis on the daily chart shows a downside pattern.
ETH produces a breakdown of the “Rising Wedge” pattern, indicating weakness around the overall look. The price was not able to break its previous swing high and is taking support near the 50-day exponential moving average. More downside, if breaches the moving average.
The volumes are below the average line and declining, with the price moving upwards, which implies a worrisome. When the market is rising while volume is declining, big money is not the one buying, more likely slowly exiting positions.
If the price breaks below the support level ($1,528), then we can expect a good downside momentum of up to $1,350.
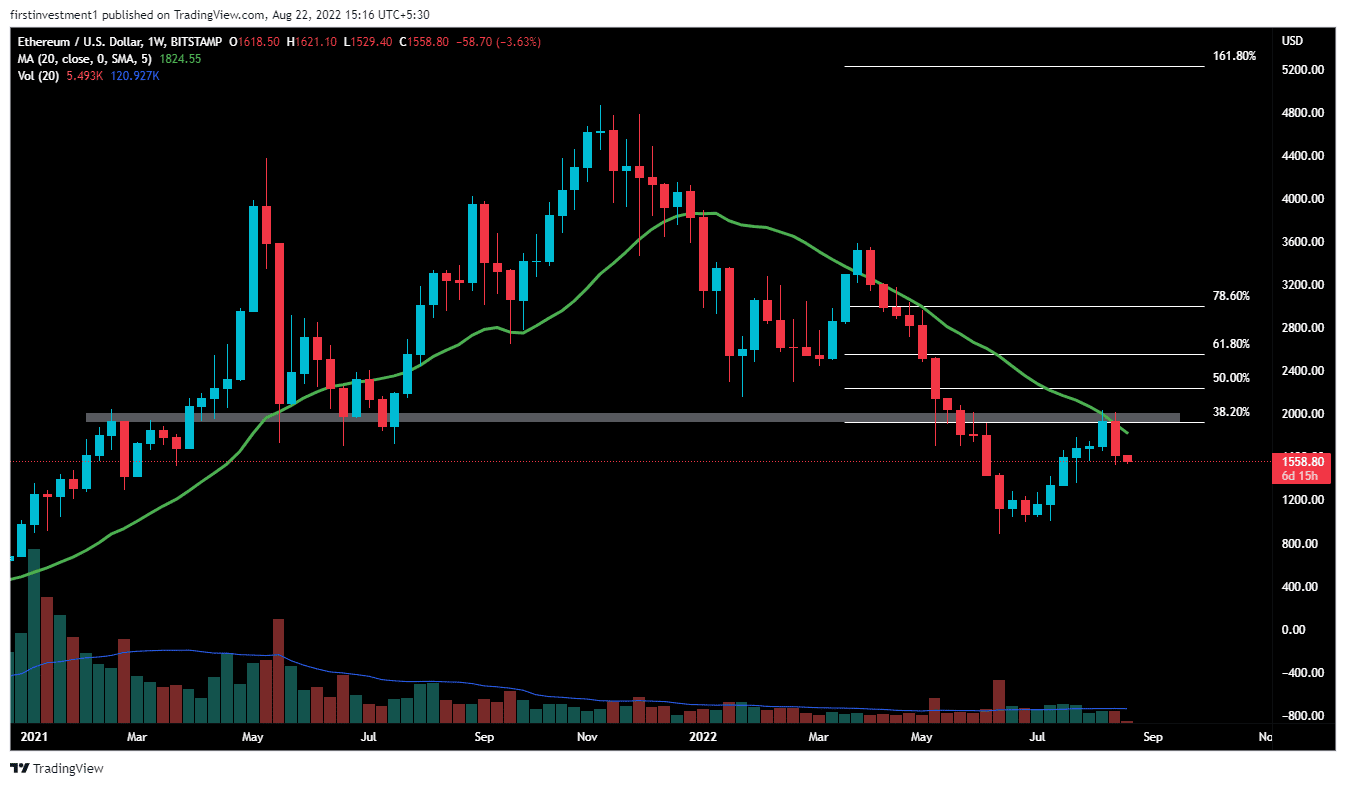
On the weekly charts, the ETH price closed above $2000 for the first time On March 29, 2021, and since then the price had made a high of $4867.
But, on May 22, 2022, the price broke the support of more than one-and-half years of $2,000, & started to fall from there up to $898, the fresh all-time low.
In the previous week, the price finally tested the $2000 level again, but the bulls could not sustain the gains, facing heavy resistance which was once acting as a support.
The price is taking resistance to the 20-day Exponential Moving Average (EMA). Along with a 38.6% Fibonacci retracement, which will act as immediate resistance for this week.
On the weekly basis, a bearish engulfing candlestick indicates the presence of sellers at the higher levels. A slippage below the $1,520 critical level would be a blessing for the bears. In that scenario, the price could find the lower targets near $1,340.
On the other hand, a resurgence of discount buying could push the price toward the $1,760 level which could invalidate the bearish outlook. And the price can be higher than $2,000 in the short term.
ETH is bearish on all time frames. Below $1,520 closing on the hourly time frame, we can put a trade on the sell side.
As of publication time, ETH/USD is exchanging hands at $1,578, down 2.45% for the day. The 24-hour trading volume is held at $18,589,056,100 with a loss of less than 1%. This indicates lower volatility over the last 24 hours.

Why Trust CoinGape
CoinGape has covered the cryptocurrency industry since 2017, aiming to provide informative insights Read more…to our readers. Our journal analysts bring years of experience in market analysis and blockchain technology to ensure factual accuracy and balanced reporting. By following our Editorial Policy, our writers verify every source, fact-check each story, rely on reputable sources, and attribute quotes and media correctly. We also follow a rigorous Review Methodology when evaluating exchanges and tools. From emerging blockchain projects and coin launches to industry events and technical developments, we cover all facets of the digital asset space with unwavering commitment to timely, relevant information.
Related Articles


- Robinhood Launches Public Testnet for Ethereum Layer 2 ‘Robinhood Chain’
- Binance Founder CZ Joins Scaramucci, Saylor to Confirm Crypto & Bitcoin Buying, “Not Selling”
- Crypto Market Bill Nears Resolution as Ripple CLO Signals Compromise After Key Meeting
- $3.5T Banking Giant Goldman Sachs Discloses $2.3B Bitcoin, Ethereum, XRP, and Solana Exposure
- Why is XRP Price Dropping Today?
- Bitcoin Price Analysis Ahead of US NFP Data, Inflation Report, White House Crypto Summit
- Ethereum Price Outlook As Vitalik Dumps ETH While Wall Street Accumulates
- XRP Price Prediction Ahead of White House Meeting That Could Fuel Clarity Act Hopes
- Cardano Price Prediction as Bitcoin Stuggles Around $70k
- Bitcoin Price at Risk of Falling to $60k as Goldman Sachs Issues Major Warning on US Stocks
- Pi Network Price Outlook Ahead of This Week’s 82M Token Unlock: What’s Next for Pi?


