Ethereum Price Analysis: $ETH Price offers Last Pullback Opportunity Before a Leap to $2135


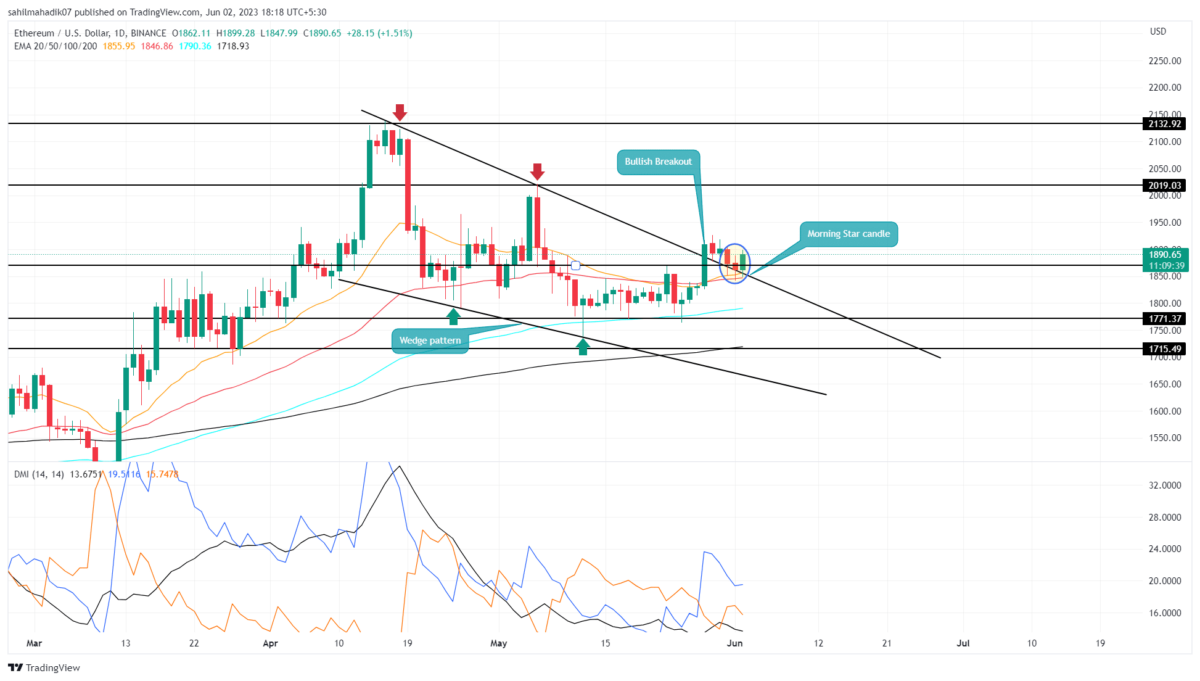
Ethereum Price Analysis: Amid the recent sell-off in the crypto market, the Ethereum price witnessed a minor pullback which retested the breached trendline of the wedge pattern. This retest is meant to check price sustainability at a higher level and validate whether the buyers are ready to make further growth. Anyhow, the bullish candle pattern called morning star offered at the bottom of this retest project the buyers are defending the reclaimed support.
Also Read: Ethereum Average Gas Fee Dropped 69% Over Last Month, Will ETH Surge?
Ethereum Price Daily Chart
- The Wedge pattern breakout signals an early sign of the end of the correction phase and the start of a new recovery rally.
- A potential uptick in the daily ADX indicator(black) will reflect the buyer’s strength for carrying the sustained rally
- The intraday trading volume in Ether is $6.1 Billion, indicating a 6% gain.
 Source- Tradingview
Currently, the Ethereum price exchanges hands at $1894, with an intraday gain of 1.69%. This price jump shows the formation of a morning star candle at the recently breached trendline indicating the market sentiment shifted from selling on bounces to buying on dips.
Thus, the increased accumulation from buyers could assist the Ethereum price in reclaiming lost ground and carrying a sustained rally. As a result, the altcoin is likely to rise 6.5% to hit the first significant supply zone of $2000, followed by the same growth potential to reach $2135.
However, if the ETH price showed no significant movement in the coming days, it would indicate some weakness in buying momentum, and therefore increase the possibility of invalidating the bullish thesis.
Is Ethereum Ready to Retake $2000?
The wedge pattern breakout has set the Ethereum price on a significant upswing in the daily chart. With sustained buying, the nearest supply zone for the altcoin is the $2000 mark. The traders must remain cautious at this supply zone as sellers could recuperate to change the trend direction.
- Directional Movement Index: A positive crossover between the DI+(blue) and DI-(orange) slope reflects a positive trend in the market.
- Exponential Moving Average: In the daily time frame chart, the 20 and 50 EMAs offer strong pullback support whereas 100 EMAs provide a suitable footing during long correction.

Why Trust CoinGape
CoinGape has covered the cryptocurrency industry since 2017, aiming to provide informative insights Read more…to our readers. Our journal analysts bring years of experience in market analysis and blockchain technology to ensure factual accuracy and balanced reporting. By following our Editorial Policy, our writers verify every source, fact-check each story, rely on reputable sources, and attribute quotes and media correctly. We also follow a rigorous Review Methodology when evaluating exchanges and tools. From emerging blockchain projects and coin launches to industry events and technical developments, we cover all facets of the digital asset space with unwavering commitment to timely, relevant information.

Related Articles


- What Will Spark the Next Bitcoin Bull Market? Bitwise CIO Names 4 Factors
- U.S. CPI Release: Wall Street Predicts Soft Inflation Reading as Crypto Market Holds Steady
- Bhutan Government Cuts Bitcoin Holdings as Standard Chartered Predicts BTC Price Crash To $50k
- XRP News: Binance Integrates Ripple’s RLUSD on XRPL After Ethereum Listing
- Breaking: SUI Price Rebounds 7% as Grayscale Amends S-1 for Sui ETF
- Solana Price Prediction as $2.6 Trillion Citi Expands Tokenized Products to SOL
- Bitcoin Price Could Fall to $50,000, Standard Chartered Says — Is a Crash Coming?
- Cardano Price Prediction Ahead of Midnight Mainnet Launch
- Pi Network Price Prediction as Mainnet Upgrade Deadline Nears on Feb 15
- XRP Price Outlook Amid XRP Community Day 2026
- Ethereum Price at Risk of a 30% Crash as Futures Open Interest Dive During the Crypto Winter


