Ethereum Price Analysis: $ETH Price offers Last Pullback Opportunity Before a Leap to $2135
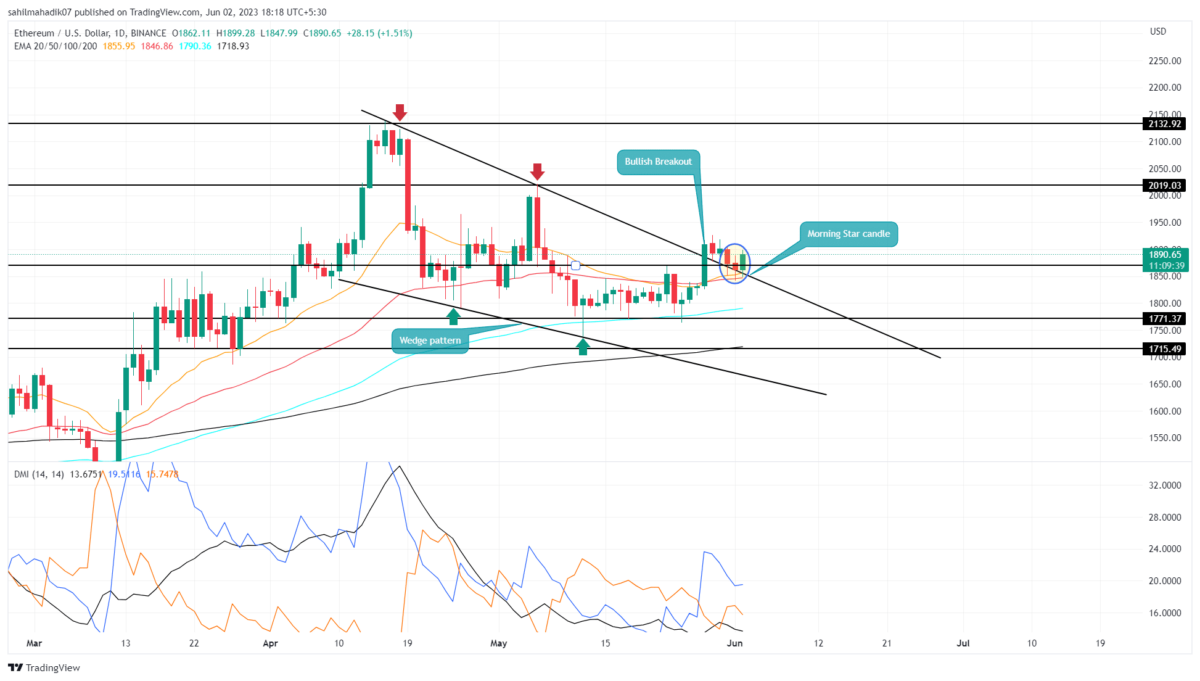
Ethereum Price Analysis: Amid the recent sell-off in the crypto market, the Ethereum price witnessed a minor pullback which retested the breached trendline of the wedge pattern. This retest is meant to check price sustainability at a higher level and validate whether the buyers are ready to make further growth. Anyhow, the bullish candle pattern called morning star offered at the bottom of this retest project the buyers are defending the reclaimed support.
Also Read: Ethereum Average Gas Fee Dropped 69% Over Last Month, Will ETH Surge?
Ethereum Price Daily Chart
- The Wedge pattern breakout signals an early sign of the end of the correction phase and the start of a new recovery rally.
- A potential uptick in the daily ADX indicator(black) will reflect the buyer’s strength for carrying the sustained rally
- The intraday trading volume in Ether is $6.1 Billion, indicating a 6% gain.
Currently, the Ethereum price exchanges hands at $1894, with an intraday gain of 1.69%. This price jump shows the formation of a morning star candle at the recently breached trendline indicating the market sentiment shifted from selling on bounces to buying on dips.
Thus, the increased accumulation from buyers could assist the Ethereum price in reclaiming lost ground and carrying a sustained rally. As a result, the altcoin is likely to rise 6.5% to hit the first significant supply zone of $2000, followed by the same growth potential to reach $2135.
However, if the ETH price showed no significant movement in the coming days, it would indicate some weakness in buying momentum, and therefore increase the possibility of invalidating the bullish thesis.
Is Ethereum Ready to Retake $2000?
The wedge pattern breakout has set the Ethereum price on a significant upswing in the daily chart. With sustained buying, the nearest supply zone for the altcoin is the $2000 mark. The traders must remain cautious at this supply zone as sellers could recuperate to change the trend direction.
- Directional Movement Index: A positive crossover between the DI+(blue) and DI-(orange) slope reflects a positive trend in the market.
- Exponential Moving Average: In the daily time frame chart, the 20 and 50 EMAs offer strong pullback support whereas 100 EMAs provide a suitable footing during long correction.
Recent Posts
- Price Analysis
Shiba Inu Price Eyes a 45% Rebound as Burn Rate Spikes 10,700%
Shiba Inu price continued its freefall and is now hovering at its lowest level since…
- Price Analysis
Expert Predicts Ethereum Price Rebound to $4k as BitMine, Long-Term Holders Buy
Ethereum price rose by 1.5% today and moved slightly above the important resistance level at…
- Price Analysis
Bitcoin Price Prediction Ahead of FOMC Minutes
Bitcoin price continues trading within a tightening range, with BTC price holding between $88,000 and…
- Price Analysis
U.S. Government Shutdown Looms: These 3 Crypto Predictions Could Explode
As the January trading session unfolds, the crypto market rose 1.07% in 24 hours, showing…
- Price Analysis
Grayscale Files for First U.S. Bittensor ETF: Will TAO Price Rally to $300 in January?
Bittensor (TAO) price climbed above $220 in the last 24 hours after Grayscale filed for…
- Price Analysis
Shiba Inu Price Prediction: Will SHIB Show Golden Cross Signal in 2026?
Discussion around a potential Golden Cross in 2026 has intensified as Shina Inu price compresses…