Ethereum Price Analysis: Is $ETH Bull Run at Risk? $1730 Support Holds the Key
Ethereum Price Analysis: The falling Ethereum price witnessed demand pressure at a local support of $1830-$1800. Considering long tail candles near $1800, if the altcoin manages to reclaim the bullish momentum, the buyers could break above the previous swing high of $1962. This breakout will catalyze further recovery in the second-most cryptocurrencies and increase the chances of ETH surpassing the $2000 psychological mark.
Also Read: Crypto Whales Bet On Ethereum, Bitcoin, And VC Spectra
Ethereum Price Daily Chart
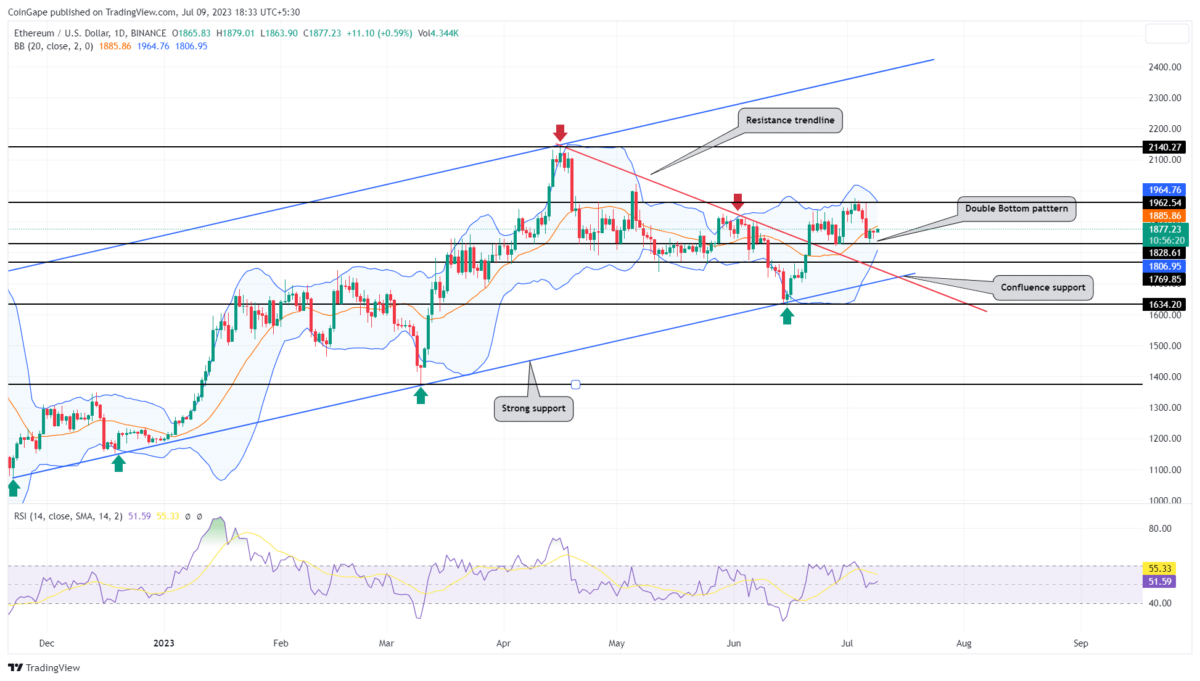
- The Ethereum price projected a bullish double pattern at $1820-1800 support.
- The rising lower band of the Bollinger band indicator could offer additional supply pressure.
- The intraday trading volume in Ether is $14.6 Billion, indicating a 16.9% loss.
Sustaining above the 1820-1800 local support, the ETH prices display a secondary reversal with lower price rejection candles. This buying pressure reflects the price trend sustaining the recent resistance trendline breakout.
By the press time, the ETH price trades at $1879 and projects a potential double-bottom reversal. With sustained buying, the price trend is expected to return to the resistance trendline projecting a 4.5% gain and reclaiming the $1960 mark.
On a larger scale, the price trend maintains a sustained recovery within a rising channel pattern. In theory, a bullish upswing in the channel leads a rally back to the overhead trendline near $2500.
Will ETH Price Lose $1730?
The ETH price upswing fails to create a significant higher high that displays a weakness in the underlying bullishness. Considering a pessimistic outlook, if the Ethereum price continues to face overhead supply near the $1960 mark. The sellers may lead a downfall to $1730 and retest the combined support of two trendline confluence. If the price sustains this support, the overall would remain bullish.
- Bollinger Band: The Bollinger Band shrinking narrow reflects a volatile sentiment in the market
- Relative Strength Index: The daily RSI slope at 50% indicates no initiation from buyers or sellers to take trend control.
Recent Posts
- Price Analysis
Will Solana Price Hit $150 as Mangocueticals Partners With Cube Group on $100M SOL Treasury?
Solana price remains a focal point as it responds to both institutional alignment and shifting…
- Price Analysis
SUI Price Forecast After Bitwise Filed for SUI ETF With U.S. SEC – Is $3 Next?
SUI price remains positioned at a critical intersection of regulatory positioning and technical structure. Recent…
- Price Analysis
Bitcoin Price Alarming Pattern Points to a Dip to $80k as $2.7b Options Expires Today
Bitcoin price rebounded by 3% today, Dec. 19, reaching a high of $87,960. This rise…
- Price Analysis
Dogecoin Price Prediction Points to $0.20 Rebound as Coinbase Launches Regulated DOGE Futures
Dogecoin price has gone back to the spotlight as it responds to the growing derivatives…
- Price Analysis
Pi Coin Price Prediction as Expert Warns Bitcoin May Hit $70k After BoJ Rate Hike
Pi Coin price rose by 1.05% today, Dec. 18, mirroring the performance of Bitcoin and…
- Price Analysis
Cardano Price Outlook: Will the NIGHT Token Demand Surge Trigger a Rebound?
Cardano price has entered a decisive phase as NIGHT token liquidity rotation intersects with structural…