 Buy $GGs
Ethereum Price Analysis: Should You Hold as Market FUD Threatens $1800 Support?


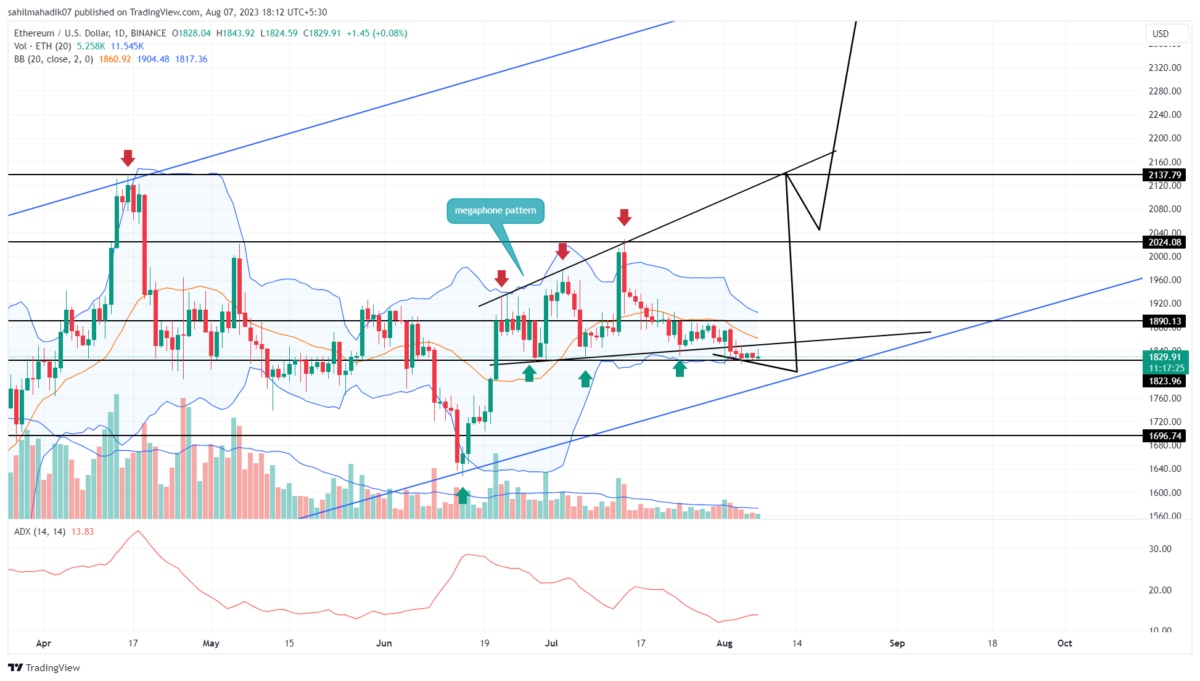
Ethereum Price Analysis: Amid the increasing FUD in the crypto market, the coin sellers obtained an upper hand and turned a month-long chart pattern in their favor. Losing a support trendline bolstering buyers to sustain higher levels for five weeks indicates upcoming ETH correction. However, is this enough to go bearish on the world’s second-largest cryptocurrency?
Ethereum Price Daily Chart
- A negative crossover between the 20-and-50-day EMA could cause bearishness in the market.
- The falling ETH can obtain suitable support at the long-coming support trendline.
- The intraday trading volume in Ether is $3.36 Billion, indicating a 29.6% gain.
 Source- Tradingview
In the last two weeks, the Ethereum price witnessed high volatility, a sideways trend resonating above the support trendline of the megaphone pattern. This chart is a sign of increasing uncertainty among market participants which leads to rising price swings.
On August 2nd, the coin price gave a bearish breakdown from the lower trendline of the chart setup. This breakdown offered sellers an additional edge which could have plunged the price another 2.2% to hit the next significant support of the ascending trendline.
In the face of increasing uncertainty, this rising support could replenish the bullish momentum to trigger a sustained recovery.
[converter id=”eth-ethereum” url=”https://coingape.com/price/converter/eth-to-usd/?amount=1″]
Can ETH Price Recuperate Bullish Recovery?
Since the breakdown of the megaphone pattern’s support, the price action is still wavering daily chart. The crackdown happened nearly a week ago and should have triggered a significant downfall, but instead, this sideways walk indicates weakness in bearish momentum. If buyers stepped in this consolidation, the coin price may return inside the pattern and mark the prior breakdown as a bear trap. This scenario would increase the buying pressure and surge the ETH price above $2000
- Bollinger Band: A downslope in the lower band of the Bollinger Band indicator reflect the selling momentum is still active.
- Average Directional Index: An uptick in the strength indicator called ADX reflects the seller’s potential to carry extended correction
Play 10,000+ Casino Games at BC Game with Ease
- Instant Deposits And Withdrawals
- Crypto Casino And Sports Betting
- Exclusive Bonuses And Rewards


Why Trust CoinGape
CoinGape has covered the cryptocurrency industry since 2017, aiming to provide informative insights Read more…to our readers. Our journal analysts bring years of experience in market analysis and blockchain technology to ensure factual accuracy and balanced reporting. By following our Editorial Policy, our writers verify every source, fact-check each story, rely on reputable sources, and attribute quotes and media correctly. We also follow a rigorous Review Methodology when evaluating exchanges and tools. From emerging blockchain projects and coin launches to industry events and technical developments, we cover all facets of the digital asset space with unwavering commitment to timely, relevant information.

Related Articles


- Crypto Market Weekly Recap: US-Iran War Steer Crypto Prices, Kraken Gets Fed Master Account, Tokenization Push March 2-6
- Bitcoin Price Faces Further Crash as Whales Liquidates Recently Bought BTC: Report
- ‘Iran Will Not Surrender’: Crypto Market Falls Again as US–Iran Tensions Rise
- Fed Vice Chair Michelle Bowman Calls for More Rate Cuts as U.S. Labor Data Disappoints
- CLARITY Act Likely to Pass by July, Says Kristin Smith
- Here’s Why Cardano Price Has Not Reclaimed $0.30
- Will XRP Price Crash as U.S. Nonfarm Payrolls Fell by 92,000 in February?
- Pi Network Price Eyes a 40% Surge as Pi Day Looms on March 14
- Top Reasons Why Circle Stock Price is Surging
- Gold Price Prediction as US-Iran War Hits the Second Week
- HOOD Stock Targets $100 as Robinhood Unveils Platinum Card and Advance Dividend Feature


