Ethereum Price Analysis: Should You Hold as Market FUD Threatens $1800 Support?
Ethereum Price Analysis: Amid the increasing FUD in the crypto market, the coin sellers obtained an upper hand and turned a month-long chart pattern in their favor. Losing a support trendline bolstering buyers to sustain higher levels for five weeks indicates upcoming ETH correction. However, is this enough to go bearish on the world’s second-largest cryptocurrency?
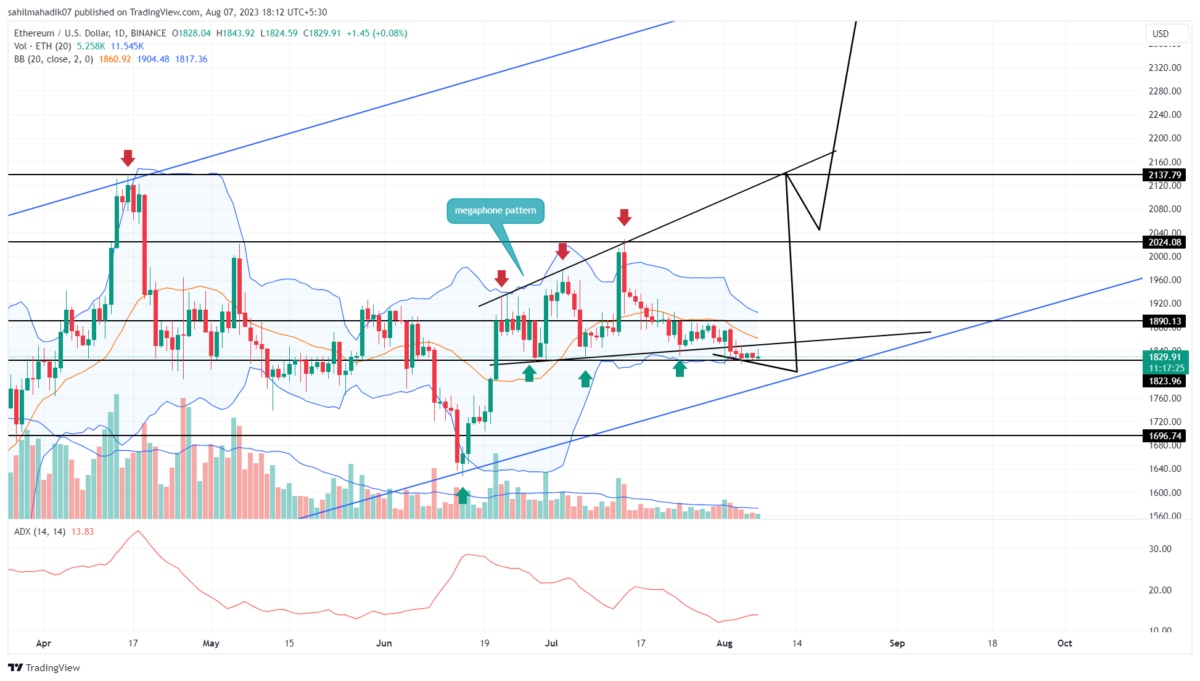
Ethereum Price Daily Chart
- A negative crossover between the 20-and-50-day EMA could cause bearishness in the market.
- The falling ETH can obtain suitable support at the long-coming support trendline.
- The intraday trading volume in Ether is $3.36 Billion, indicating a 29.6% gain.
In the last two weeks, the Ethereum price witnessed high volatility, a sideways trend resonating above the support trendline of the megaphone pattern. This chart is a sign of increasing uncertainty among market participants which leads to rising price swings.
On August 2nd, the coin price gave a bearish breakdown from the lower trendline of the chart setup. This breakdown offered sellers an additional edge which could have plunged the price another 2.2% to hit the next significant support of the ascending trendline.
In the face of increasing uncertainty, this rising support could replenish the bullish momentum to trigger a sustained recovery.
[converter id=”eth-ethereum” url=”https://coingape.com/price/converter/eth-to-usd/?amount=1″]
Can ETH Price Recuperate Bullish Recovery?
Since the breakdown of the megaphone pattern’s support, the price action is still wavering daily chart. The crackdown happened nearly a week ago and should have triggered a significant downfall, but instead, this sideways walk indicates weakness in bearish momentum. If buyers stepped in this consolidation, the coin price may return inside the pattern and mark the prior breakdown as a bear trap. This scenario would increase the buying pressure and surge the ETH price above $2000
- Bollinger Band: A downslope in the lower band of the Bollinger Band indicator reflect the selling momentum is still active.
- Average Directional Index: An uptick in the strength indicator called ADX reflects the seller’s potential to carry extended correction
Recent Posts
- Price Analysis
Binance Coin Price Risks Crash to $700 as Key BSC Metric Plunges 80%
Binance Coin price dropped by over 1% today, Dec. 29, as the crypto market remained…
- Price Analysis
SUI Price Forecast: What’s Next for SUI in 2026 After $78.9M Token Unlocks?
SUI price has spent recent sessions consolidating within a narrow range. The action reflect controlled…
- Price Analysis
Solana Price Prediction: How High Could SOL Go in January 2026?
Solana price showed signs of strength in early January 2026, hovering near $127 after a…
- Price Analysis
Top 3 Predictions for Bitcoin price, Ethereum price and XRP price for 2026 According to Analysts
Bitcoin price, Ethereum price, and XRP price show renewed strength heading into 2026 after daily…
- Price Analysis
Is $1 Dogecoin Price Technically Possible in 2026?
As the years draw to a close, Dogecoin trades above $0.12 amid a broader crypto…
- Price Analysis
Bitcoin Price Year-End Prediction: Analysts Highlight Key Levels Before 2025 Close
Bitcoin price hovered at $87,755 on December 28, 2025, as the year came to an…