Ethereum Price Analysis: This Chart Pattern Fuels Long-Term Growth In $ETH Price
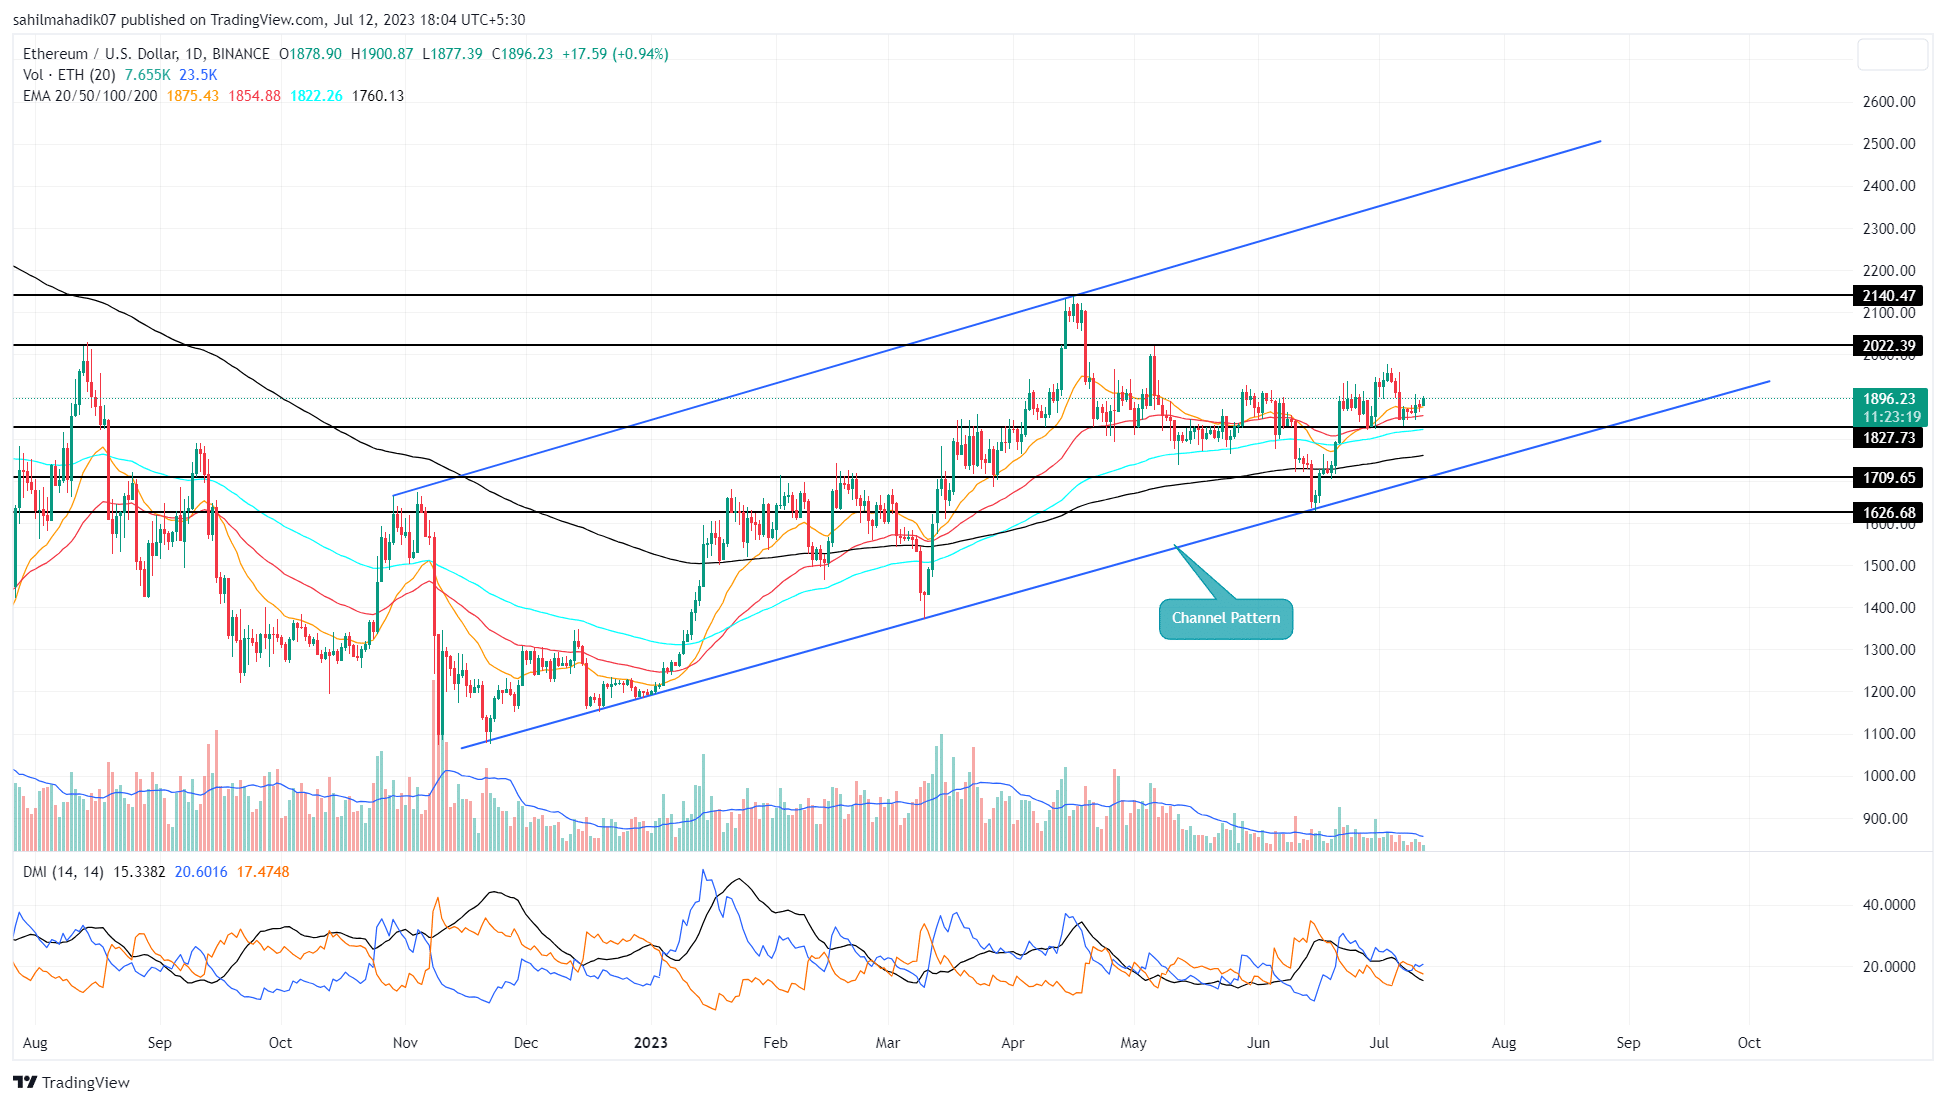
Ethereum Price Analysis: Amid the mid-June recovery, the Ethereum price rebounded from the support trendline of the rising channel pattern. Over the past seven months, the price has bounced back several times from this support indicating an active accumulation level for buying. Here’s how this pattern could further influence the ETH price.
Also Read: Bitcoin (BTC) Set For $35000, Ethereum (ETH) Above $2000 As US CPI Inflation Falls
Ethereum Price Daily Chart
- The $1827 level stands as a strong support to maintain a bullish recovery.
- The rising channel pattern governs the current recovery rally in Ethereum
- The intraday trading volume in Ether is $4.85 Billion, indicating a 20% gain.
Over the past four weeks, the Ethereum price has gained 16.4% as it rebounded from the $1624 support. However, recently the recovery rally has started showing a loss of momentum and is struggling to surpass the $2000 psychological barrier.
Currently, the ETH price trades at $1890 and is trying to sustain above the $1827 support. Despite the recent correction, the buyers maintain a higher low formation indicating the Dow theory for uptrend is not invalidated.
Under the influence of channel patterns, the second largest cryptocurrency is in a recovery cycle within the chart structure. Therefore, with sustaining buying, the coin price could see gradual growth to reach the upper trendline near $2400.
[converter id=”eth-ethereum” url=”https://coingape.com/price/converter/eth-to-usd/?amount=1″]
What if Ethereum Breaks $1824?
In case, the market sentiment shows no improvement in the coming days, the breakdown below $1824 will trigger a sign of significant correction. A potential downfall could plunge the prices back to $1750 aligned with the channel pattern’s support trendline. Until this support is intact the market participants can maintain a bullish outlook.
- Exponential Moving Average: The daily EMAs(20, 50, and 100) moving below the ETH price reflect multiple support to sustained bullish rallies.
- Directional Movement Index: A bullish crossover state in DI+(blue) and DI-(orange) reflect the buyer’s attempt to rise higher
Recent Posts
- Price Analysis
Pi Coin Price Prediction as Expert Warns Bitcoin May Hit $70k After BoJ Rate Hike
Pi Coin price rose by 1.05% today, Dec. 18, mirroring the performance of Bitcoin and…
- Price Analysis
Cardano Price Outlook: Will the NIGHT Token Demand Surge Trigger a Rebound?
Cardano price has entered a decisive phase as NIGHT token liquidity rotation intersects with structural…
- Price Analysis
Will Bitcoin Price Crash to $74K as Japan Eyes Rate Hike on December 19?
Bitcoin price continues to weaken after breaking below its recent consolidation range, now trading within…
- Price Analysis
Bitwise Predicts Solana Price Will Hit New All-Time Highs in 2026
Solana price declined by 4% over the past 24 hours, breaking below the key $130…
- Price Analysis
Bitcoin Price Outlook: Capriole Founder Warns of a Drop Below $50K by 2028
Bitcoin price narratives continue to evolve as long-term downside risks regain attention. Bitcoin price discussions…
- Price Analysis
XRP Price Rare Pattern Points to a Surge to $3 as ETFs Cross $1B Milestone
XRP price dropped by 1.2% today, Dec. 17, continuing a downward trend that started in…