Ethereum Price Analysis: Will Ongoing Correction Push $ETH Price Below $1800?
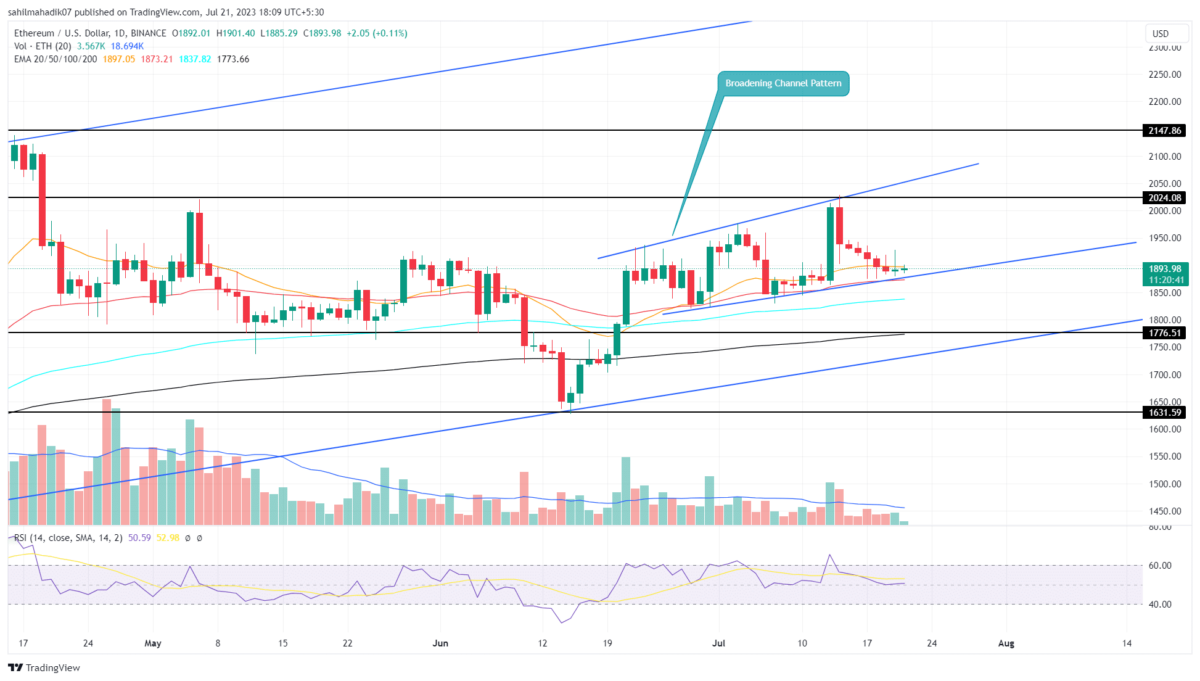
Ethereum Price Analysis: Despite the current volatility in the cryptocurrency market, the Ethereum price has demonstrated impressive recovery, consistently adhering to the diverging trendlines of broadening channel patterns. This pattern developed signals a period of increased volatility and indecision between buyers and sellers. Thus, interested traders can for this chart setup’s maturity grab a direct trade in the second-largest cryptocurrency.
Also Read: Ethereum Price Dump Incoming? ETH CEXs Inflows Hits 2-Month High
Ethereum Price Daily Chart
- A bearish breakdown from a lower support trendline could trigger a significant correction
- The 200-day EMA wavering near the $1800 level indicates a strong demand zone
- The intraday trading volume in Ether is $6.3 Billion, indicating a 14% gain.
After witnessing a steady correction for over a week, the Ethereum price plunged to the lower support trendline of the wedge pattern. The daily candles with short bodies and rejections on both sides indicate an uncertain market sentiment.
By the press time, the ETH price trades at $1885 with an intraday loss of 0.34%. Anyhow, a common outcome for a rising wedge pattern is the breakdown below the support trendline, accelerating the downside momentum.
A breakdown below the support trendline with a daily candle will signal the continuation of the correction phase and could plunge the price back to $1800 support.
The $1800 level accompanied by a long-coming support trendline and 200-day EMA could offer sold footing for coin buyers. Thus, the sellers are less likely to break this barrier with a weak bearish momentum.
Can ETH Price Rise back to $2000?
If the coin price manages to hold the lower trendline for a few more trading days, the buyers could reattempt to bounce higher and prolong the current recovery cycle. This bullish reversal could lead the price back to an overhead trendline wobbling around $2050. However, a breakout above the resistance trendline is needed to give better confirmation of higher growth.
- Relative Strength Index: The daily RSI slope accentuates a neutral sentiment in the market.
- Exponential Moving Average: The daily EMAs(50, 100, and 200) assist traders to sustain ongoing rallies.
Recent Posts
- Price Analysis
Will Solana Price Hit $150 as Mangocueticals Partners With Cube Group on $100M SOL Treasury?
Solana price remains a focal point as it responds to both institutional alignment and shifting…
- Price Analysis
SUI Price Forecast After Bitwise Filed for SUI ETF With U.S. SEC – Is $3 Next?
SUI price remains positioned at a critical intersection of regulatory positioning and technical structure. Recent…
- Price Analysis
Bitcoin Price Alarming Pattern Points to a Dip to $80k as $2.7b Options Expires Today
Bitcoin price rebounded by 3% today, Dec. 19, reaching a high of $87,960. This rise…
- Price Analysis
Dogecoin Price Prediction Points to $0.20 Rebound as Coinbase Launches Regulated DOGE Futures
Dogecoin price has gone back to the spotlight as it responds to the growing derivatives…
- Price Analysis
Pi Coin Price Prediction as Expert Warns Bitcoin May Hit $70k After BoJ Rate Hike
Pi Coin price rose by 1.05% today, Dec. 18, mirroring the performance of Bitcoin and…
- Price Analysis
Cardano Price Outlook: Will the NIGHT Token Demand Surge Trigger a Rebound?
Cardano price has entered a decisive phase as NIGHT token liquidity rotation intersects with structural…