
Ethereum Price Forecast: Sell Signals Multiply, Hint Correction to $2,000


Highlights
- Ethereum's current price is $2,638 with potential correction predicted to $2,000 due to bearish divergence and high leverage.
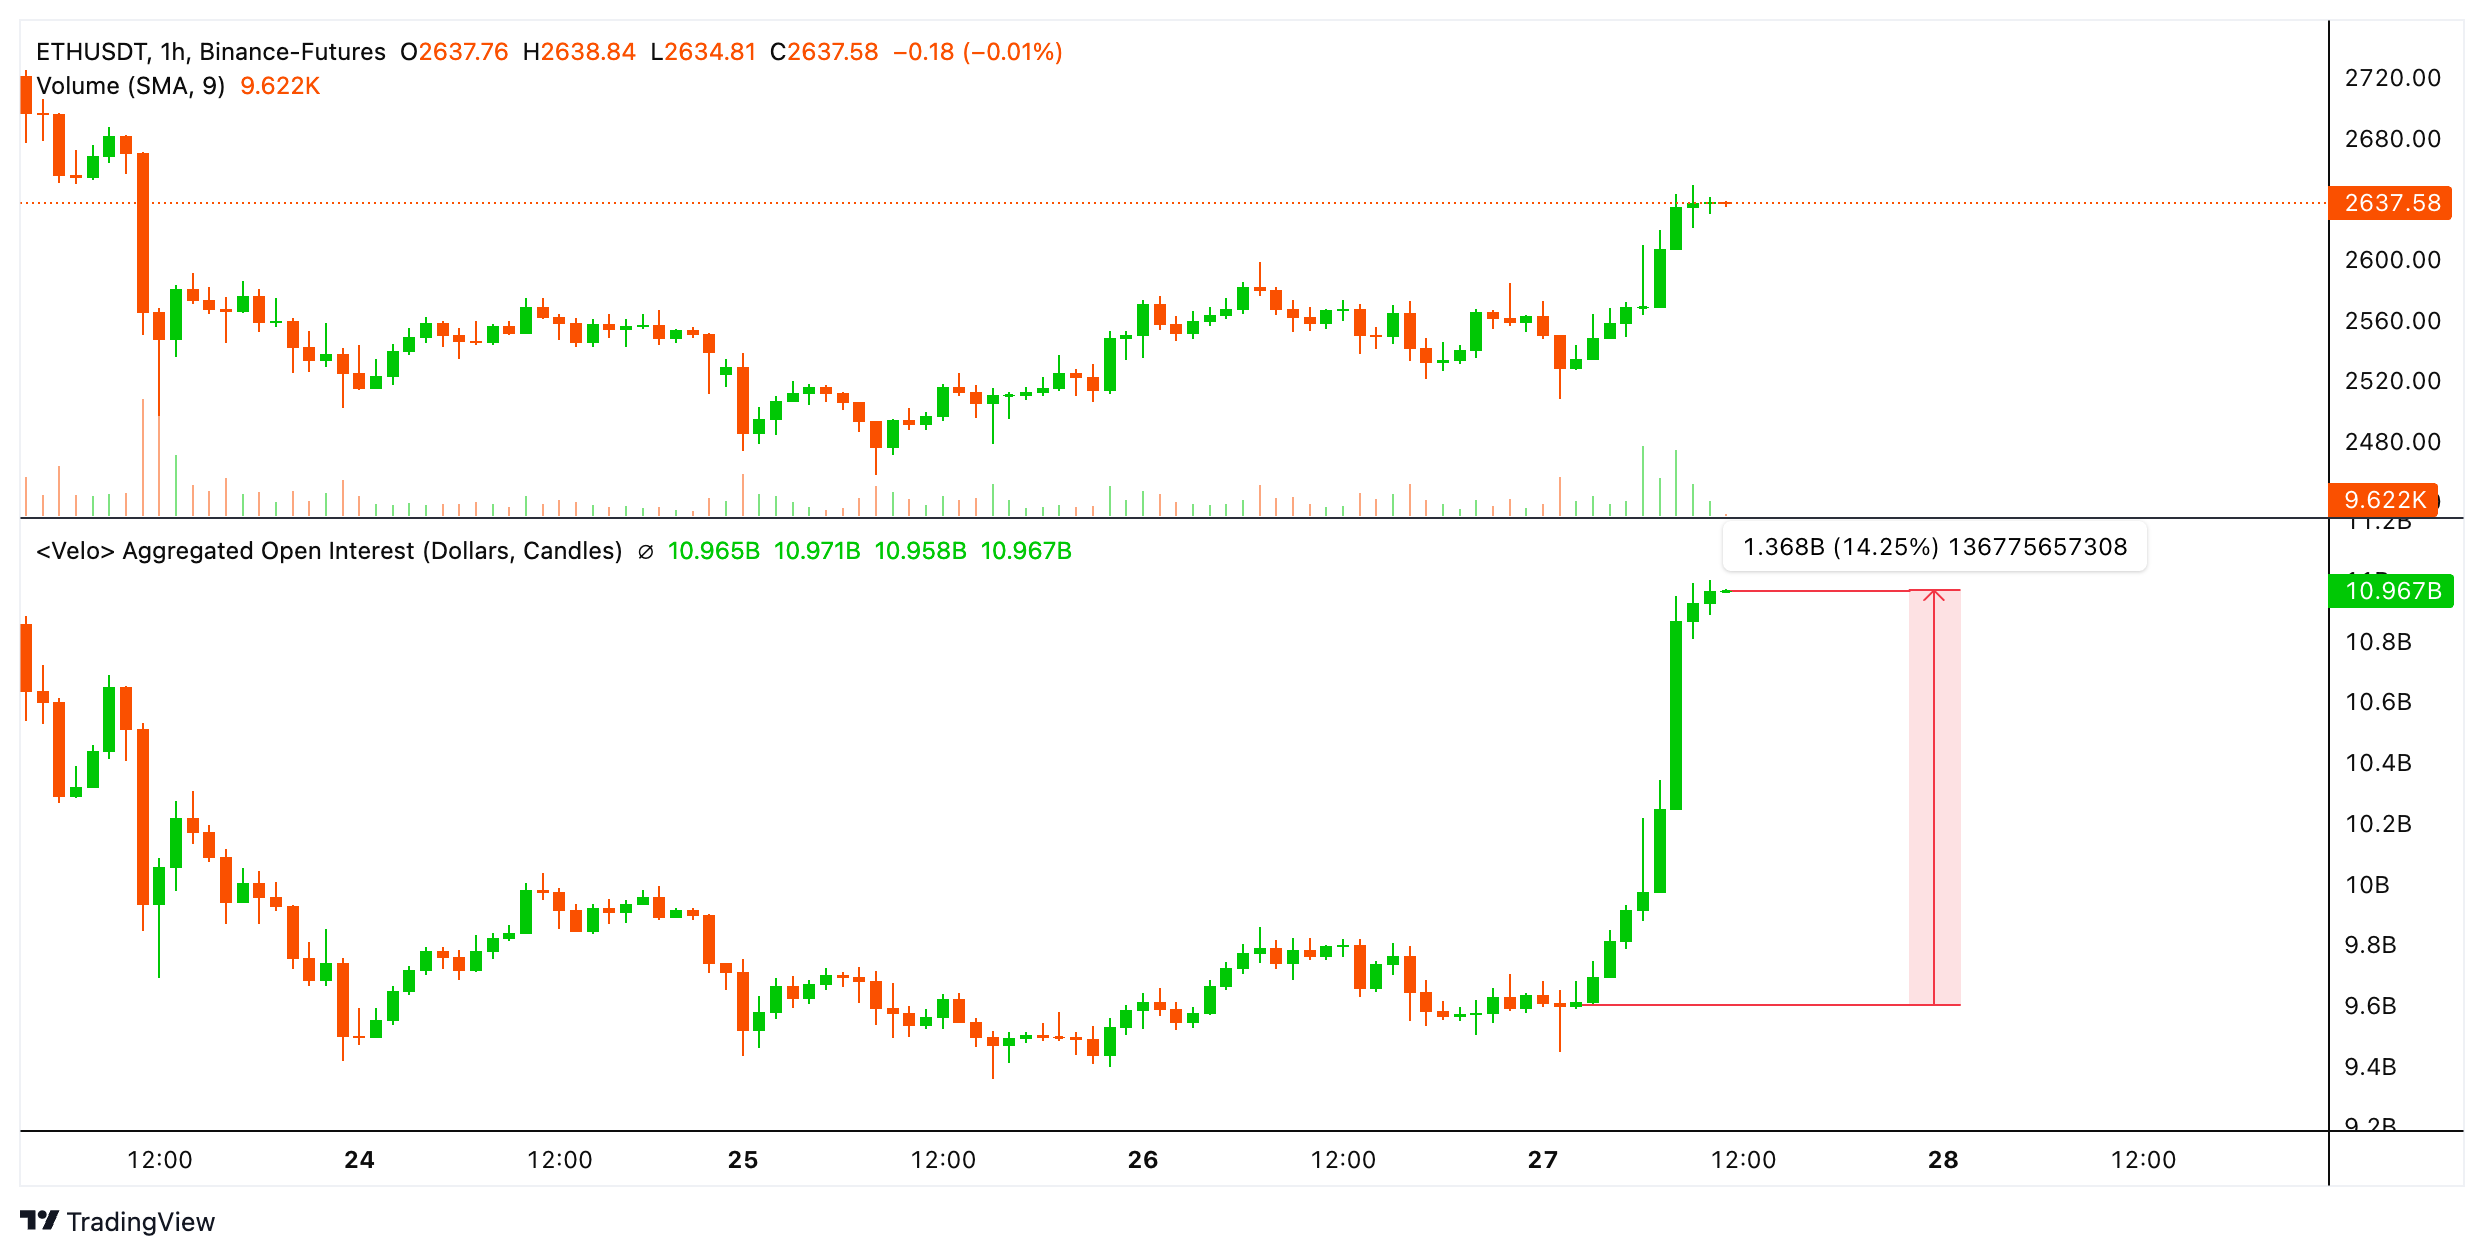
- Ethereum's open interest has increased by $1.36 billion, signaling high leverage and potential market reversal.
- Analysts predict a potential drop to $2,000 or a range of $1,800 to $2,100 if the current sell signals play out.
Ethereum (ETH) price showed strength despite Bitcoin’s brief pullback on Monday. Is this faux strength, or will the ETH price continue to ascend? A closer look at technical analysis and on-chain data indicates clear signs of exhaustion and a potential crash to $2,000.
Sell Signs Flash as Ethereum Price Rally Stalls Below $3,000
At press time, Ethereum trades at $2,638 and is up 3.10% today. Due to the recent uptick, the market cap of ETH hovers around $318 billion.
Sell Signal 1: Bearish Divergence Hints $2,000 Retest Likely
On the daily chart, Ethereum’s price has been trading between $2,323 and $2,738 with signs of bullish exhaustion. While ETH produced almost equal highs in the past two weeks, the momentum indicators like RSI and AO produced lower highs. This non-conformity is termed bearish divergence and hints ETH price is due for a short-term pullback.
The Relative Strength Index (RSI) has recently dropped below the overbought zone. The Awesome Oscillator (AO) indicator is approaching the mean level with declining red histogram bars, noting a decline in momentum, similar to the RSI.
The chances of reversal are also high, considering that Ethereum’s price also tagged the February 22 supply zone, extending from roughly $2,800 to $2,600. In trading terminology, a supply zone refers to an area where a significant spike in sell orders has previously led to a steep correction. A retest of this area often leads to a sharp rejection if the buying pressure is weak.
The key levels to watch if Ethereum price begins its correction here include the weekly bullish breaker, extending from $1,800 to $2,100. A revisit of this level is likely considering the aforementioned bearish divergence.

Sell Signal 2: Open Interest Climbs $1.36B, Signals High Leverage
With $3,000 just 13% rally away, the Open Interest (OI) for Ethereum has increased by $1.36 billion in nine hours or less. While OI denotes investor interest, a large spike like the one seen in the past nine hours is a clear sign of leverage. This uptick in OI shows increased leverage in the system.
Typically, when leverage is ramped up at such a rate, markets often tend to reverse to cull eager participants. Hence, the second sell signal also indicates that a drop in Ethereum price is highly likely.
Sell Signal 3: Profit-taking Likely to Trigger Correction
Santiment’s 30-day MVRV Ratio (Market Value to Realized Value) reads 24%, which is the average unrealized profit of ETH investors who purchased a month ago. Typically, spikes into the 10% to 20% ‘danger zone’ territory often lead to reversals as these investors book profits.
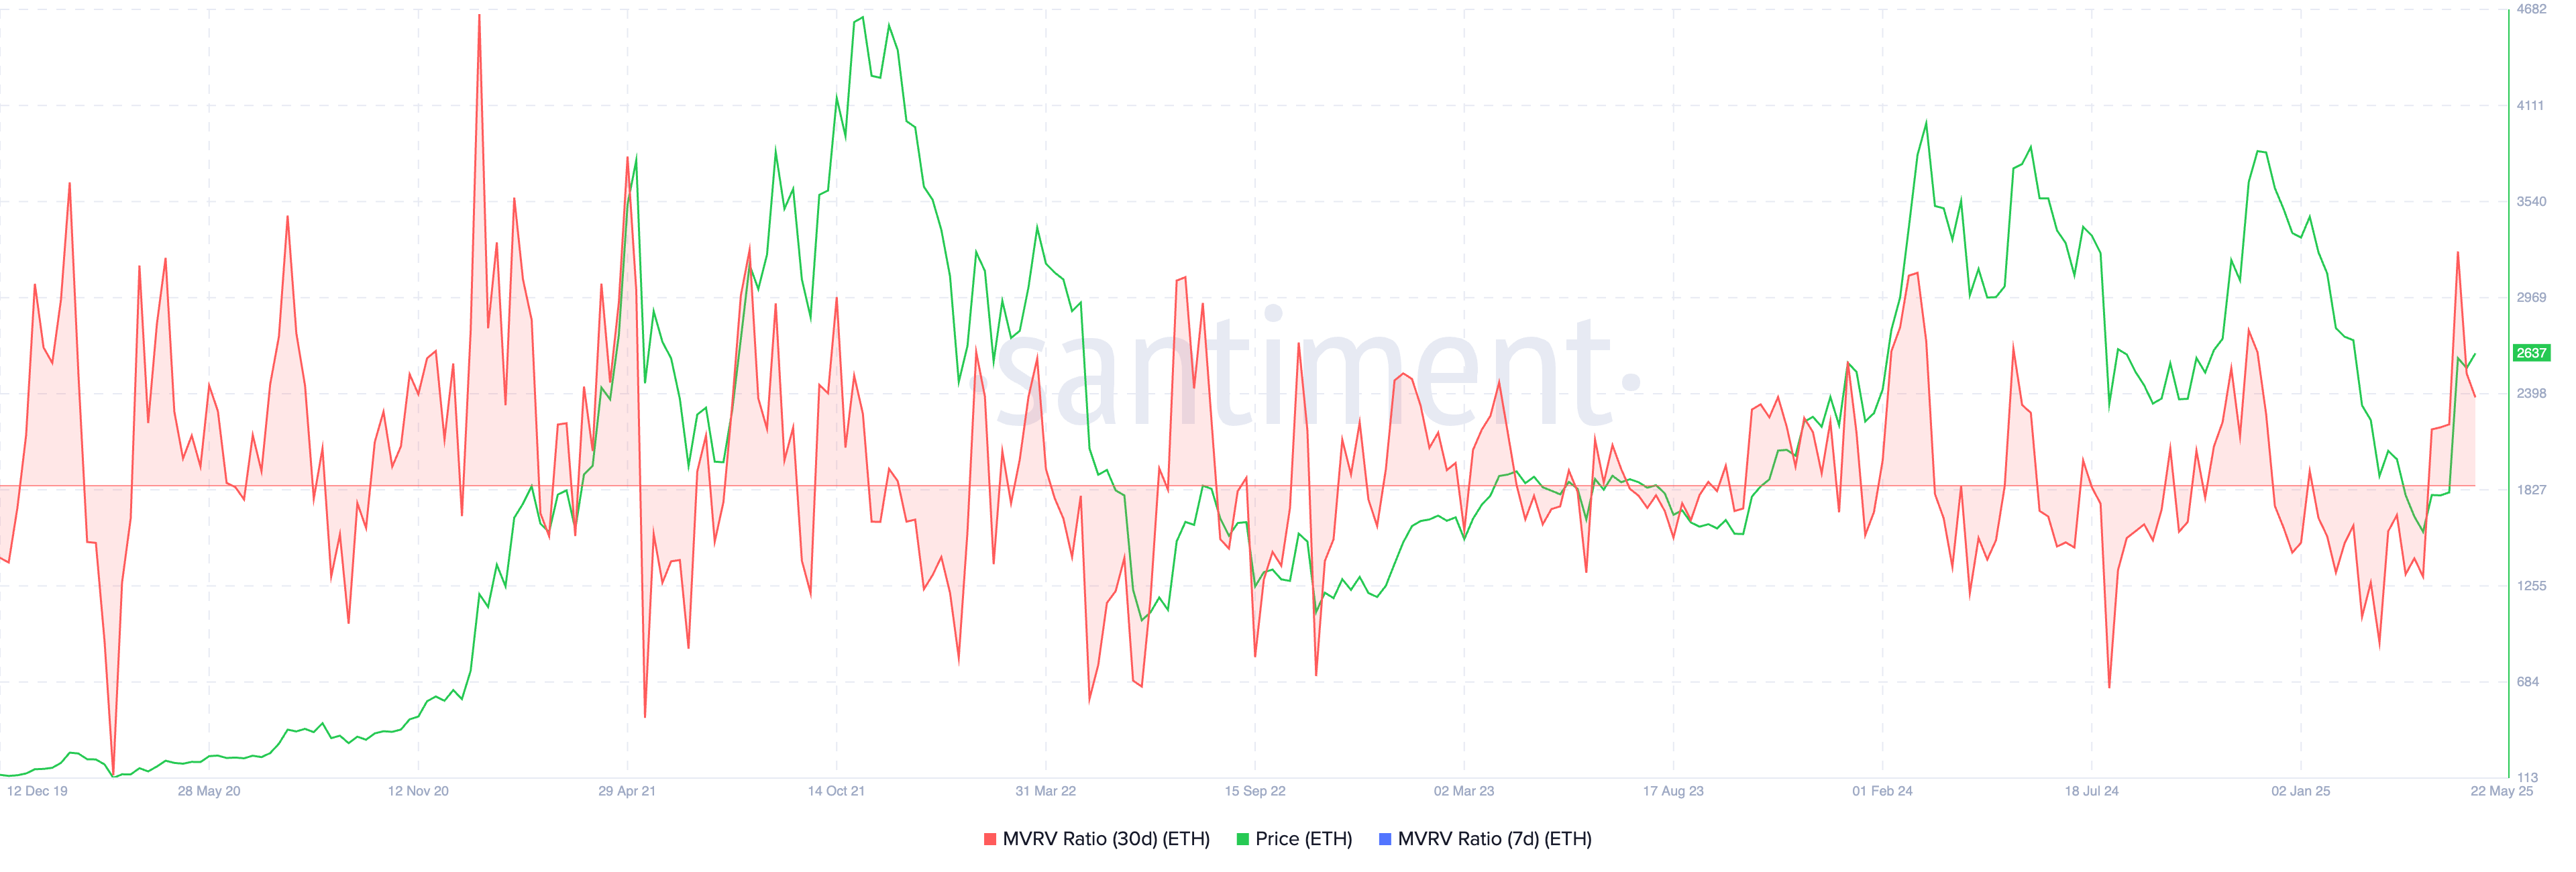
To conclude, the short-term profit-taking potential, coupled with a significant increase in Open Interest, suggests an overextended and overleveraged move for Ethereum price. These two indicators lend credence to the bearish divergence noted on the daily chart, which hints at a correction to the next key support level of $2,000.
For a long-term price prediction of Ethereum 2030-2050: Read This
Play 10,000+ Casino Games at BC Game with Ease
- Instant Deposits And Withdrawals
- Crypto Casino And Sports Betting
- Exclusive Bonuses And Rewards

Frequently Asked Questions (FAQs)
1. What is Ethereum's current price and market cap?
2. What are the sell signals indicating for Ethereum's price?
3. What is the potential support level for Ethereum's price if it corrects?

Why Trust CoinGape
CoinGape has covered the cryptocurrency industry since 2017, aiming to provide informative insights Read more…to our readers. Our journal analysts bring years of experience in market analysis and blockchain technology to ensure factual accuracy and balanced reporting. By following our Editorial Policy, our writers verify every source, fact-check each story, rely on reputable sources, and attribute quotes and media correctly. We also follow a rigorous Review Methodology when evaluating exchanges and tools. From emerging blockchain projects and coin launches to industry events and technical developments, we cover all facets of the digital asset space with unwavering commitment to timely, relevant information.


- Playnance’s GCOIN Goes Live On MEXC as Crypto Firm Targets Global Expansion
- Why Is the Crypto Market Crashing Today? (March 18)
- Breaking: U.S. PPI Inflation Comes In Hot At 3.4% Ahead Fed Rate Decision
- Bitcoin ETFs Record 7-day Inflow Streak — But Short-Term Holders Are Cashing Out
- Top Reasons Why ETH, XRP, DOGE, SOL, ADA Are Dropping Suddenly
- Gold Price Crashed After U.S. Core PPI Came In Higher Than Expected.
- XRP Price Prediction 2026 Ahead of Major XRPL Technical Upgrades
- Will CRCL Stock Rally To $150 This Week After Clear Street Upgrade?
- Will Dogecoin Price Break $0.15 Before March End 2026?
- Bitcoin Price Forecast: Will BTC Break $80k Ahead of Fed Decision Today?
- MSTR Stock Prediction as Strategy Makes Largest Bitcoin Purchase in 2026 and Analyst Targets BTC Price $100K


