Ethereum Price Heading to $2000? Bear Trap Sets the Stage for High Recovery


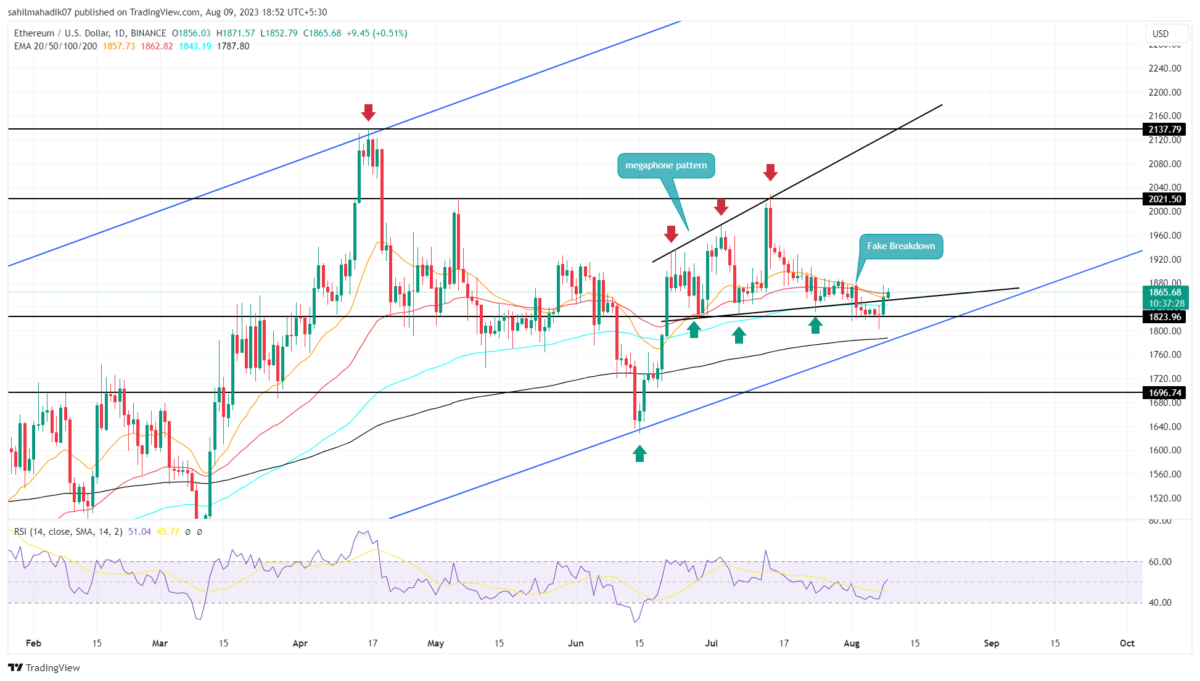
On August 2nd, the Ethereum price gave a bearish breakdown from the support trendline of the megaphone pattern. This breakdown was supposed to extend the prevailing correction phase but instead, the price action went sideways indicating a lack of conviction from the sellers. Moreover, the buyers took advantage of this uncertainty, and push the price back into the chart pattern, signaling a bear trap scenario. Should you buy now?
Also Read: Ethereum Price Doldrums: How to Survive Second Stage Capitulation
Ethereum Price Daily Chart
- The ETH price reclaiming the support trendline set a bullish upswing of 8%
- The recently reclaim daily EMAs(20, 50, 100, and 200) could offer additional support to crypto buyers
- The intraday trading volume in Ether is $6.9 Billion, indicating a 16% gain.
 Source- Tradingview
Amid the increasing uncertainty in the crypto market, the ETH sellers failed to provide a suitable follow-up to the support breakdown of August 2nd. The coin price has nearly a week of period to push the price lower, the sideways action indicated weakness in bearish momentum.
As a result, the buyers eventually raised the coin price higher with a daily candle closing above the breached trendline. This breakout marked the prior breakdown as a fake or trap, offering market bull a better opportunity.
With an intraday gain of 0.53%, the coin price provides a suitable follow-up, suggesting a potential upswing in the near future.
[converter id=”eth-ethereum” url=”https://coingape.com/price/converter/eth-to-usd/?amount=1″]
Can ETH Price Recuperate Bullish Recovery?
The bear trap scenario offers buyers to counter with a stronger comeback. If the Ethereum price currently trades at $1869 and if it manages to sustain the reclaimed support, the buyers could drive the price 8% higher to hit $2020, followed by $2137.
- Exponential Moving Average: The Ethereum price back above the daily EMAs(20, 50, 100, and 200) provides readers with an extra edge.
- Relative strength index: The daily RSI slope rises above 50% indicating increasing bullish momentum.

Why Trust CoinGape
CoinGape has covered the cryptocurrency industry since 2017, aiming to provide informative insights Read more…to our readers. Our journal analysts bring years of experience in market analysis and blockchain technology to ensure factual accuracy and balanced reporting. By following our Editorial Policy, our writers verify every source, fact-check each story, rely on reputable sources, and attribute quotes and media correctly. We also follow a rigorous Review Methodology when evaluating exchanges and tools. From emerging blockchain projects and coin launches to industry events and technical developments, we cover all facets of the digital asset space with unwavering commitment to timely, relevant information.

Related Articles


- Bitcoin Shows Greater Weakness Than Post-LUNA Crash; Is a Crash Below $60K Next?
- XRP Tops BTC, ETH in Institutional Flows As Standard Chartered Lowers 2026 Forecasts
- Bitcoin vs. Gold: Expert Predicts BTC’s Underperformance as Options Traders Price in $20K Gold Target
- CLARITY Act: White House to Hold Another Meeting as Crypto and Banks Stall on Stablecoin Yield Deal
- Bitcoin as ‘Neutral Global Collateral’? Expert Reveals How BTC Price Could Reach $50M
- Dogecoin, Shiba Inu, Pepe Coin Price Predictions As BTC Crashes Below $68k
- Ethereum Price Outlook as Harvard Shifts Focus from Bitcoin to ETH ETF
- HOOD and COIN Stock Price Forecast as Expert Predicts Bitcoin Price Crash to $10k
- XRP Price Prediction Ahead of Supreme Court Trump Tariff Ruling
- Crypto Price Prediction For This Week: Dogecoin, Solana and Cardano
- Bitcoin Price Prediction: How Could Brazil’s Strategic Bitcoin Reserve Proposal Impact BTC?


