Ethereum Price Prediction As Bull Trap Puts $ETH At Risk of 12% Drop
The second week of December has been highly volatile for the crypto market, as the two leading cryptocurrencies faced intense overhead supply. This indecisiveness could be triggered by the speculation surrounding the CPI inflation and Fed rate decision. Thus, the ETH price witnessed storing selling pressure which led to a breakdown below key support threats for further fall.
Also Read: El Salvador Announces Bitcoin Volcano Bonds Issuance Date
Should you Accumulate at $2000?
- A failed attempt to break the $2400 set the alarm to the ETH price for a bearish reversal
- The rising price may face intensified supply at $2400.
- The intraday trading volume in Ether is $12.2 Billion, indicating a gain.
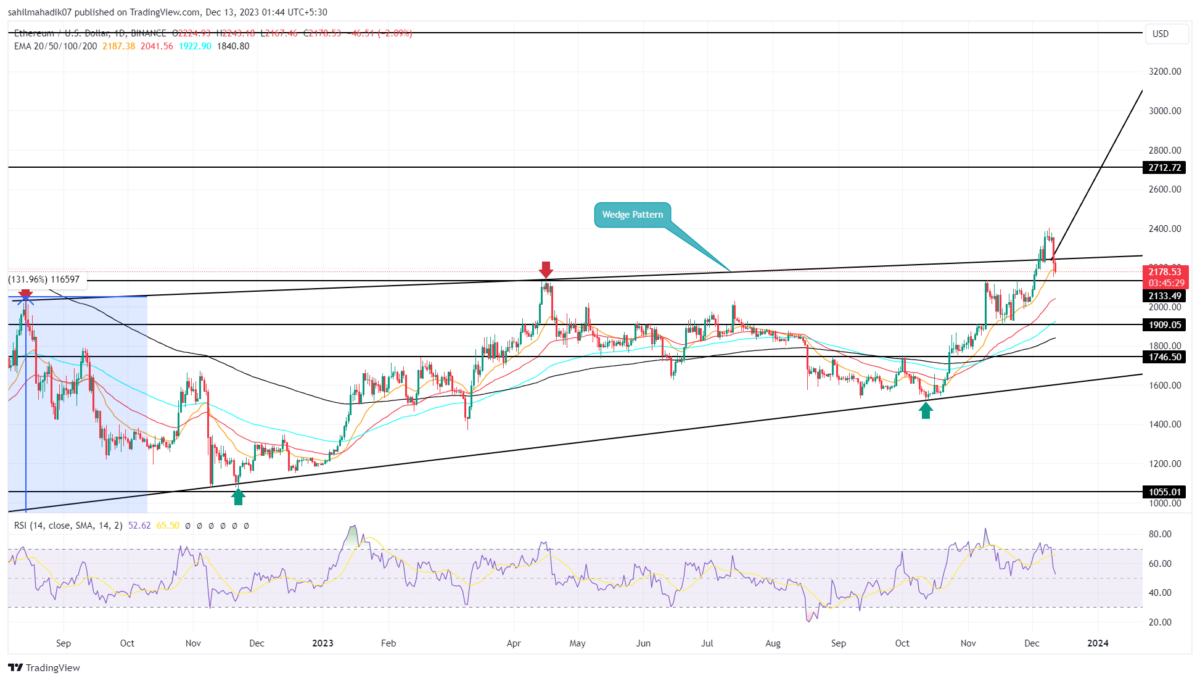
On December 5th, the Ethereum price recovery gave a bullish breakout from the resistance trendline of a long-coming resistance or wedge pattern. This chart pattern carried a steady and low recovery for over a year, and therefore an upside breakout is needed.to recuperate the exhausted bullish momentum and start a directional trend.
However, with the increasing supply pressure, the Ethereum coin price reverted from $2385 and reentered the wedge pattern. This breakdown undermined the last breakout and marked it as a fake breakdown.
By the press time, the ETH price was trading at $2189 with an intraday loss of 1.56 %. If the selling momentum persists, the bears could attempt a breakdown immediately below $2133.
Should this occur, the selling momentum would accelerate and could tumble the prices 12% to hit $1916.
ETH Total Liquidations Chart
Amid the current uncertainty, the Ethereum coin has witnessed a significant surge in long liquidation on December 12th. According to data from Coinglass, the market experienced a substantial amount of long liquidations of $87.74. This sudden exit of long traders is likely to introduce more sell orders into the market, potentially reinforcing the ongoing correction.
- Bollinger Band: A midline of the Bollinger Band indicator provides dynamic support to BNB.
- Relative strength index: The daily RSI drop below 60% reflects weakness among trades.
Recent Posts
- Price Analysis
Pi Coin Price Prediction as Expert Warns Bitcoin May Hit $70k After BoJ Rate Hike
Pi Coin price rose by 1.05% today, Dec. 18, mirroring the performance of Bitcoin and…
- Price Analysis
Cardano Price Outlook: Will the NIGHT Token Demand Surge Trigger a Rebound?
Cardano price has entered a decisive phase as NIGHT token liquidity rotation intersects with structural…
- Price Analysis
Will Bitcoin Price Crash to $74K as Japan Eyes Rate Hike on December 19?
Bitcoin price continues to weaken after breaking below its recent consolidation range, now trading within…
- Price Analysis
Bitwise Predicts Solana Price Will Hit New All-Time Highs in 2026
Solana price declined by 4% over the past 24 hours, breaking below the key $130…
- Price Analysis
Bitcoin Price Outlook: Capriole Founder Warns of a Drop Below $50K by 2028
Bitcoin price narratives continue to evolve as long-term downside risks regain attention. Bitcoin price discussions…
- Price Analysis
XRP Price Rare Pattern Points to a Surge to $3 as ETFs Cross $1B Milestone
XRP price dropped by 1.2% today, Dec. 17, continuing a downward trend that started in…