Ethereum Price Prediction: Distribution Phase at Key Resistance Hints 16% Drop


Ethereum Price Prediction: Since the onset of November, Ethereum has experienced heightened volatility with the $1830 level proving to be a formidable resistance, impeding its upward trajectory. This resistance has led to two weeks of indecisive trading, as evidenced by long-wicked candles which reflect the market’s current uncertainty. Investors are pondering whether this consolidation could usher in another bearish downturn.
Also Read: US Seizes $54 Mln Crypto, Including Ethereum, In Narcotics Scheme
Is a Correction Underway?
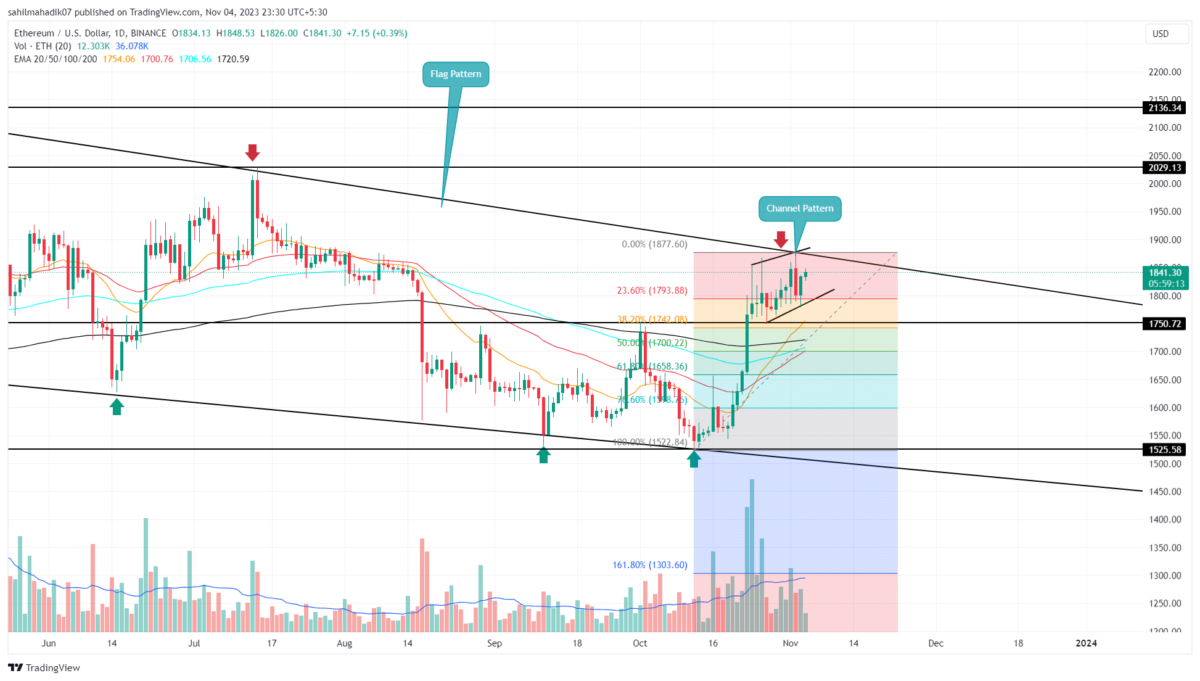
- The channel pattern leads to the current consolidation in the ETH price
- A bearish breakdown channel pattern would set the price at 16%.
- The intraday trading volume in Ether is $5.3 Billion, indicating a 27% loss.
 Source- Tradingview
The ongoing recovery in the Ethereum price journey initiated from the mid-October low of $1522 to a three-month high of $1874, amounting to a 23% increase. Nonetheless, this rally brought it to a resistance level that aligns with the upper trendline long-standing wedge pattern, potentially introducing a new supply zone for the market participants.
Mirroring the Bitcoin price consolidation, the ETH price is encountering substantial selling pressure around the $1830 threshold, as suggested by the long-wicked rejection candles. However, a detailed analysis at shorter timeframes, reveals a rising channel pattern demarcated by two ascending trendlines.
Should this pattern hold, we might see this altcoin oscillate within the $1800 to $1880 band, indicating a moderate bullish continuation.
From a bearish viewpoint, a breach below the channel’s lower boundary could precipitate a short-term downturn for Ethereum. The Fibonacci Retracement Tool delineates critical support levels at $1750 (corresponding to the 38.2% Fibonacci level) and $1700 (at the 50% retracement mark).
A retracement to these zones could potentially be a precursor to a renewed ascension above the $1880 threshold, maintaining the larger bullish narrative.
[converter id=”eth-ethereum” url=”https://coingape.com/price/converter/eth-to-usd/?amount=1″]
Can the ETH Price Fall Back to $1500?
Ethereum’s daily chart over the last seven months illustrates a methodical pullback within the confines of a descending wedge pattern. The latest uptick was a part of this pattern, testing both of its boundaries. If the pattern endures, a correction towards the $1500 mark might materialize, though traditionally, such a pattern concludes with a bullish reversal, as Coingape mentioned in our previous article.
- Exponential Moving Average: The daily EMAs(20, 50, 100, and 200) waver around the $1780 to $1700 price bracket, fortifying this area as a strong support zone.
- Relative Strength Index: The daily RSI forming lower highs within the overbought territory signals a possible price retracement.

Why Trust CoinGape
CoinGape has covered the cryptocurrency industry since 2017, aiming to provide informative insights Read more…to our readers. Our journal analysts bring years of experience in market analysis and blockchain technology to ensure factual accuracy and balanced reporting. By following our Editorial Policy, our writers verify every source, fact-check each story, rely on reputable sources, and attribute quotes and media correctly. We also follow a rigorous Review Methodology when evaluating exchanges and tools. From emerging blockchain projects and coin launches to industry events and technical developments, we cover all facets of the digital asset space with unwavering commitment to timely, relevant information.
Related Articles


- XRP News: Ripple Taps UK Investment Giant to Bring RWA Tokenization on XRP Ledger
- The Web3 Wallet Is Maturing. What Should We Expect?
- Godex Review: No-KYC exchange for private crypto conversions
- US Jobs Data: Bitcoin Falls to $66K as Wall Street Sees Rise in Nonfarm Payrolls
- Breaking: Binance, Franklin Templeton Launch Tokenized Fund Collateral for Institutions
- BTC Price Prediction Ahead of US Jobs Report, CPI Data and U.S. Government Shutdown
- Ripple Price Prediction As Goldman Sachs Discloses Crypto Exposure Including XRP
- Bitcoin Price Analysis Ahead of US NFP Data, Inflation Report, White House Crypto Summit
- Ethereum Price Outlook As Vitalik Dumps ETH While Wall Street Accumulates
- XRP Price Prediction Ahead of White House Meeting That Could Fuel Clarity Act Hopes
- Cardano Price Prediction as Bitcoin Stuggles Around $70k


