Ethereum Price Prediction: Distribution Phase at Key Resistance Hints 16% Drop
Ethereum Price Prediction: Since the onset of November, Ethereum has experienced heightened volatility with the $1830 level proving to be a formidable resistance, impeding its upward trajectory. This resistance has led to two weeks of indecisive trading, as evidenced by long-wicked candles which reflect the market’s current uncertainty. Investors are pondering whether this consolidation could usher in another bearish downturn.
Also Read: US Seizes $54 Mln Crypto, Including Ethereum, In Narcotics Scheme
Is a Correction Underway?
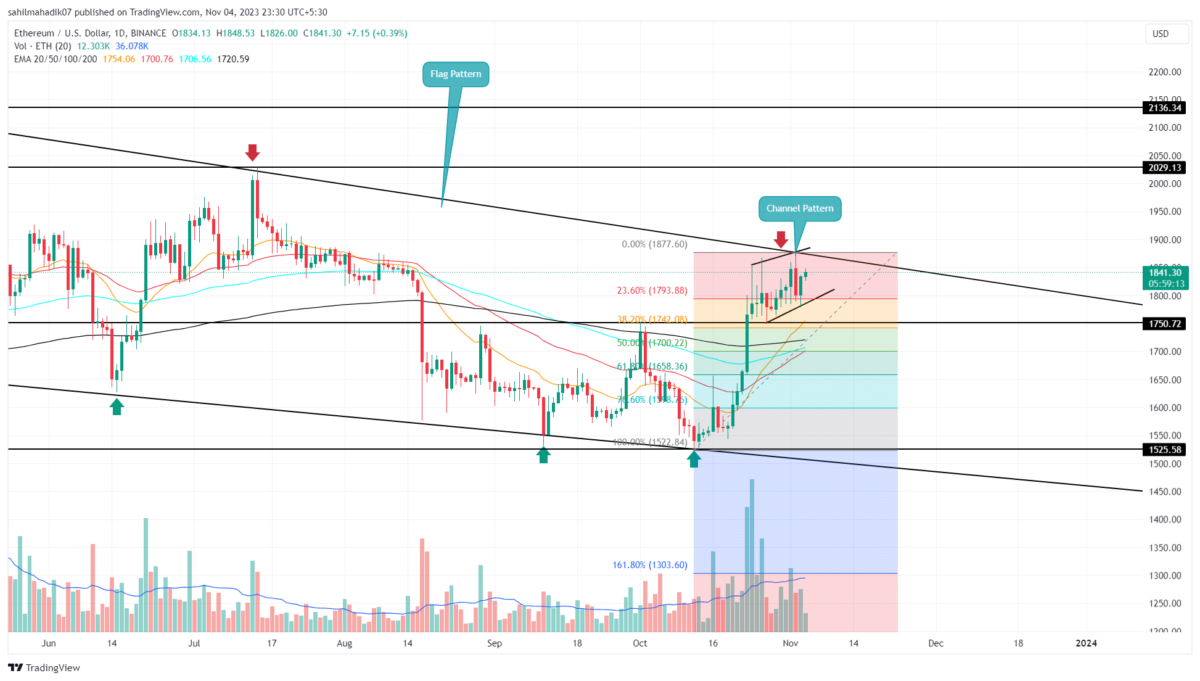
- The channel pattern leads to the current consolidation in the ETH price
- A bearish breakdown channel pattern would set the price at 16%.
- The intraday trading volume in Ether is $5.3 Billion, indicating a 27% loss.
The ongoing recovery in the Ethereum price journey initiated from the mid-October low of $1522 to a three-month high of $1874, amounting to a 23% increase. Nonetheless, this rally brought it to a resistance level that aligns with the upper trendline long-standing wedge pattern, potentially introducing a new supply zone for the market participants.
Mirroring the Bitcoin price consolidation, the ETH price is encountering substantial selling pressure around the $1830 threshold, as suggested by the long-wicked rejection candles. However, a detailed analysis at shorter timeframes, reveals a rising channel pattern demarcated by two ascending trendlines.
Should this pattern hold, we might see this altcoin oscillate within the $1800 to $1880 band, indicating a moderate bullish continuation.
From a bearish viewpoint, a breach below the channel’s lower boundary could precipitate a short-term downturn for Ethereum. The Fibonacci Retracement Tool delineates critical support levels at $1750 (corresponding to the 38.2% Fibonacci level) and $1700 (at the 50% retracement mark).
A retracement to these zones could potentially be a precursor to a renewed ascension above the $1880 threshold, maintaining the larger bullish narrative.
[converter id=”eth-ethereum” url=”https://coingape.com/price/converter/eth-to-usd/?amount=1″]
Can the ETH Price Fall Back to $1500?
Ethereum’s daily chart over the last seven months illustrates a methodical pullback within the confines of a descending wedge pattern. The latest uptick was a part of this pattern, testing both of its boundaries. If the pattern endures, a correction towards the $1500 mark might materialize, though traditionally, such a pattern concludes with a bullish reversal, as Coingape mentioned in our previous article.
- Exponential Moving Average: The daily EMAs(20, 50, 100, and 200) waver around the $1780 to $1700 price bracket, fortifying this area as a strong support zone.
- Relative Strength Index: The daily RSI forming lower highs within the overbought territory signals a possible price retracement.
Recent Posts
- Price Analysis
Will Bitcoin Crash to $74K as Japan Eyes Rate Hike on December 19?
Bitcoin price continues to weaken after breaking below its recent consolidation range, now trading within…
- Price Analysis
Bitwise Predicts Solana Price Will Hit New All-Time Highs in 2026
Solana price declined by 4% over the past 24 hours, breaking below the key $130…
- Price Analysis
Bitcoin Price Outlook: Capriole Founder Warns of a Drop Below $50K by 2028
Bitcoin price narratives continue to evolve as long-term downside risks regain attention. Bitcoin price discussions…
- Price Analysis
XRP Price Rare Pattern Points to a Surge to $3 as ETFs Cross $1B Milestone
XRP price dropped by 1.2% today, Dec. 17, continuing a downward trend that started in…
- Price Analysis
DOGE Whales Add 138M Coins in 24 Hours: Will Dogecoin Price Rebound Above $0.15?
Dogecoin price traded at $0.1304 on Tuesday, up 1.39% in the last 24 hours.…
- Price Analysis
Ethereum Price Outlook Hinges on Whale Moves: Dump Below $2,800 or Reclaim Above $3K Next?
Ethereum price is trading below $3,000 after failing to sustain a short-lived recovery. The market…