Ethereum Price Prediction: $ETH Price Poised to Hit $1700 as Buyers Lose Major Support


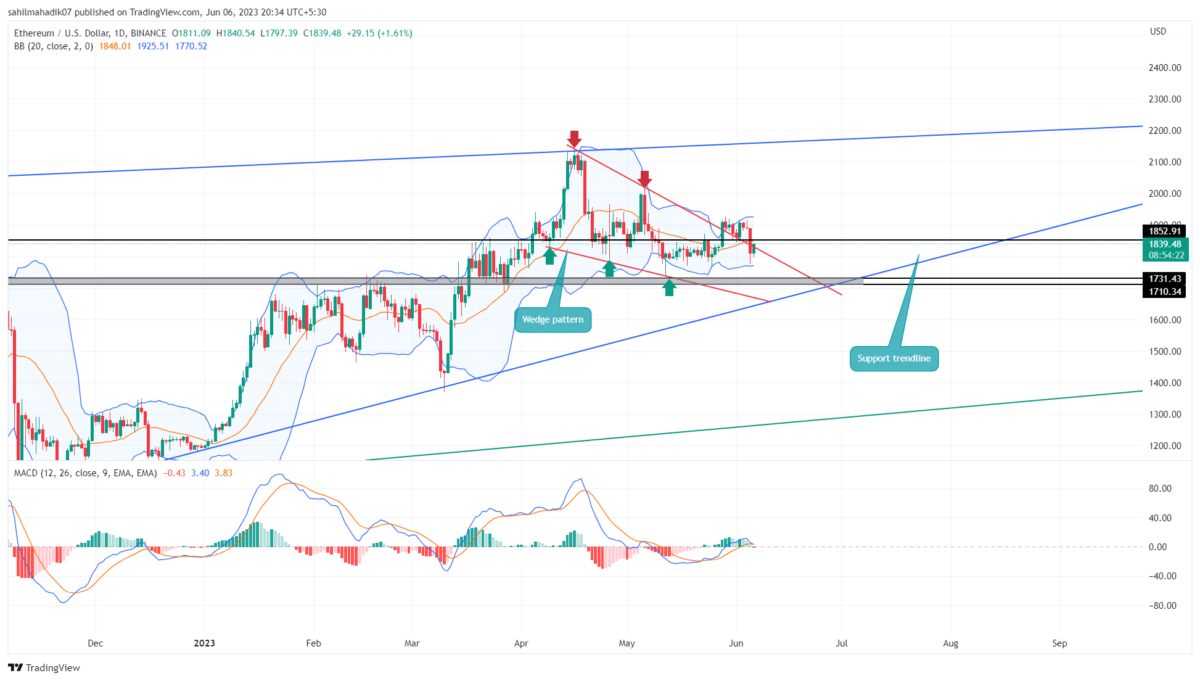
Ethereum Price Prediction: On May 28th, the Ethereum price gave a bullish breakout from a falling wedge pattern indicating the buyers are trying to regain trend control. However, with increased selling pressure in the market, the prices failed to sustain higher levels and plunged back below the breached trendline. This failed breakout indicates the sellers are still dominating and could prolong the ongoing correction.
Also Read: Binance Moves Millions Of Ethereum (ETH) For Staking As BETH Depegs
Ethereum Price Daily Chart
- A breakdown below the $1850 support accelerates the supply momentum in the ETH price
- The 200-day EMA support wavering near the $1700 mark creates a strong demand zone
- The intraday trading volume in Ether is $9.8 Billion, indicating an 87% gain.
 Source- Tradingview
On June 5th, the Ethereum price witnessed a nearly 4.25% intraday loss and a slump below the combined support of $1850 and the recently reclaimed trendline. This breakdown may trap hasty buyers who entered on the May 28th breakout and could get forced to liquidate if they maintain a narrow stop loss.
Today, the ETH price is up 1.2%, and retest the breached trendline as potential resistance. If the coin price showed sustainability below this trendline, the sellers will likely tumble this coin 6.6% down to hit $1700.
Anyhow, the daily chart shows a long-coming support trendline(blue) leading the overall support in ETH. Until this trendline persists, the coin holders could maintain their bullish outlook.
Will Ethereum Price Ready to Hit $2000?
The wedge pattern breakout was a sign of a trend reversal which set the ETH price on a recovery path. In technical analysis, the swing highs formed during the development of the chart pattern are the significant target. Therefore, if the buyer breaches $1922 in the coming week, the price will witness a sharp rally to $2000.
- Bollinger Band: The Ethereum price plunged below the midline of the BB indicator offering an extra edge to market traders.
- Moving Average Convergence Divergence: A bearish crossover between the MACD(blue) and signal(orange) reflects the bear trend remains intact.


- Do Kwon Faces Up to 12 Years in Prison Over ‘Colossal’ Role in $40B TerraUSD Collaps
- ProShares Drops 3x Bitcoin, Ethereum, XRP ETF Plans After SEC Pushback
- Bitcoin Eyes Fresh Demand as Indiana Advances Bill for Crypto Investments
- Crypto Bill Markup Unlikely This Month Amid DeFi, Stablecoin Yield and Conflict Disputes, Expert Says
- Breaking: U.S. PCE Inflation Rises To 2.8%, Bitcoin Falls
- XRP Price Prediction As Spot ETF Inflows Near $1 Billion: What’s Next?
- Solana Price Outlook: Reversal at Key Support Could Lead to $150 Target
- Is Cardano Price at Risk of a 50% Crash Ahead of the Midnight Launch?
- Is Chainlink Price Headed for $20 as Reserves Pass 1M LINK?
- Ethereum Price Breaks Out of Falling Wedge: Next Target Now Set at $5K
- Is ZCash Price Set for a Bigger Rally After Its 10% Surge on the Bitget Listing?


Why Trust CoinGape
CoinGape has covered the cryptocurrency industry since 2017, aiming to provide informative insights Read more…to our readers. Our journal analysts bring years of experience in market analysis and blockchain technology to ensure factual accuracy and balanced reporting. By following our Editorial Policy, our writers verify every source, fact-check each story, rely on reputable sources, and attribute quotes and media correctly. We also follow a rigorous Review Methodology when evaluating exchanges and tools. From emerging blockchain projects and coin launches to industry events and technical developments, we cover all facets of the digital asset space with unwavering commitment to timely, relevant information.
Premium Partners


