Ethereum Price Prediction: Will Buyers Reclaim $1700 this Week?


Over the previous week, as the broader cryptocurrency market embarked on a recovery journey, the ETH price experienced a bullish reversal from the $1550 support on September 12th. This bullish pivot propelled the coin to register a 6.8% uptick, emboldening the buyers to confront the overhead resistance trendline. Crypto traders must closely watch the price behavior at this barrier as it may have a significant influence on the near future price of Ether coin.
Also Read: What’s ERC-7512? A New Standard Proposed By Ethereum Developers
Will the ETH Price Fall Back to $1450?
- A bullish breakout from the overhead trendline will set the coin price at 6%
- The Fear and Greed index at 57% reflects a neutral sentiment among traders/
- The intraday trading volume in Ether is $4.7 Billion, indicating a 15% loss.
 Source- Tradingview
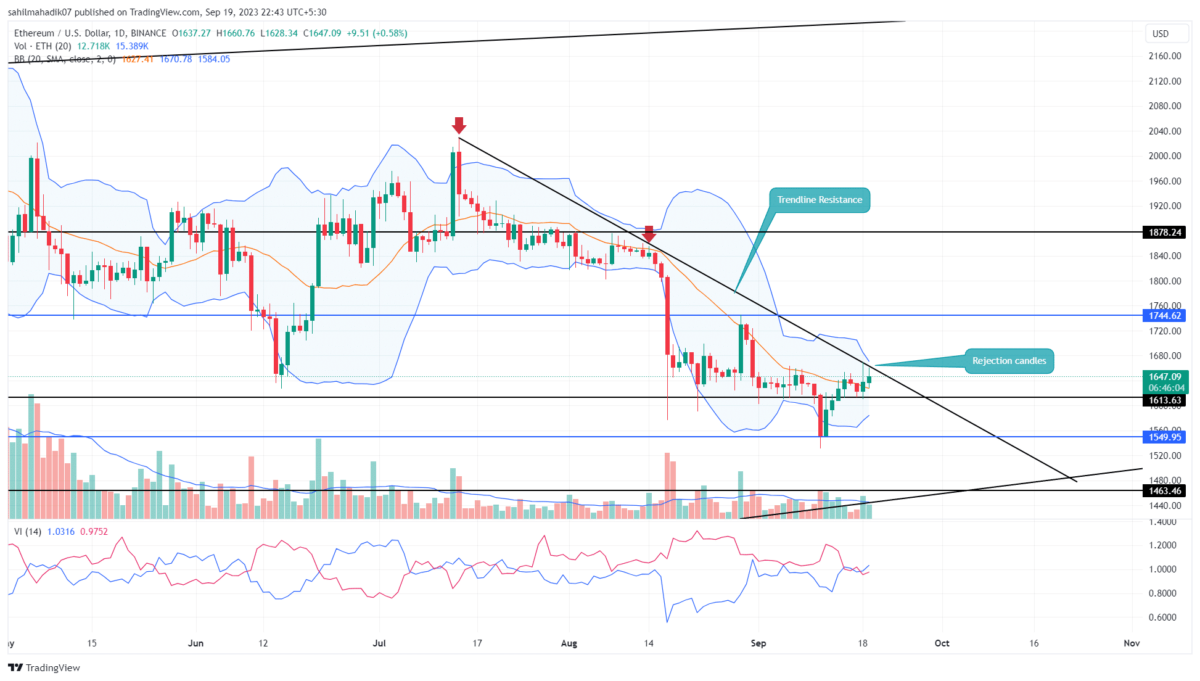
The current retracement phase characterizing the Ethereum price dynamics is encapsulated by a descending resistance trendline. Tracing back through the past sixty days, the coin price has turned down from this dynamic resistance on two separate instances by this mutable boundary, signifying a resurgence in selling pressure whenever this barrier is approached.
As of the latest data, ETH price is oscillating at $1655, exhibiting signs of a pullback in the vicinity of the aforementioned trendline. The long-wick rejection is a testament to sellers’ commitment to maintain their stronghold over this threshold, suggesting potential continuation of the prevalent bearish phase.
Should the ETH price plunge beneath the low of the September 18th candle, pinned at $1610, it may pave the way for bears to steer the asset beneath the $1550 floor, with a trajectory targeting the $1460 mark, translating to a prospective decline of 9.5%.
[converter id=”eth-ethereum” url=”https://coingape.com/price/converter/eth-to-usd/?amount=1″]
Can Buyers Reclaim $1800?
While the bearish perspective for Ethereum appears valid, the resurgence in market optimism might fortify the bulls’ resolve to grapple with the overhanging trendline. An upside breakout of this resistance, cemented by a daily candle closing, could herald the termination of the corrective phase. Such a development would potentially furnish the bullish momentum to chart a course aiming for the $1745, followed by the $1878 milestone.
- Bollinger Band: The narrow range of Bollinger Band accentuates market uncertainty.
- Directional Movement Index: A bullish crossover between the DI+(blue) and DI-(orange) slope would increase the potential for an upside breakout.

Why Trust CoinGape
CoinGape has covered the cryptocurrency industry since 2017, aiming to provide informative insights Read more…to our readers. Our journal analysts bring years of experience in market analysis and blockchain technology to ensure factual accuracy and balanced reporting. By following our Editorial Policy, our writers verify every source, fact-check each story, rely on reputable sources, and attribute quotes and media correctly. We also follow a rigorous Review Methodology when evaluating exchanges and tools. From emerging blockchain projects and coin launches to industry events and technical developments, we cover all facets of the digital asset space with unwavering commitment to timely, relevant information.
Related Articles


- XRP Payments Utility Expands as Ripple Launches Treasury Platform
- Trump’s Crypto Adviser Confirms Probe Into Alleged Theft From U.S. Crypto Reserve
- Federal Reserve to Hold Interest Rates Until June, Crypto Traders Predict
- Breaking: USDT Issuer Tether Launches GENIUS Act-Compliant USAT Stablecoin
- Grayscale Executives, Parent Firm Trim Holdings in XRP, Solana, & Chainlink ETFs
- Shiba Inu Price Outlook As SHIB Burn Rate Explodes 2800% in 24 Hours
- Pi Network Price Prediction as 134M Token Unlock in Jan 2026 Could Mark a New All-Time Low
- Bitcoin Price Outlook as US Dollar Index Hits 4-Year Low, Gold Soars
- Stock Market Today: Nasdaq, Dow, S&P 500 Futures Rise Ahead of Fed Meeting, and Jobless Claims
- Bitcoin And XRP Price Prediction Ahead of FOMC Meeting Tomorrow, Jan 28
- XRP Price Prediction as Ripple Scores Big Partnership in Cash-Rich Saudi Arabia


