Ethereum Price Prepares Next Leap with this Bullish Pattern; Is $2130 Next Target?
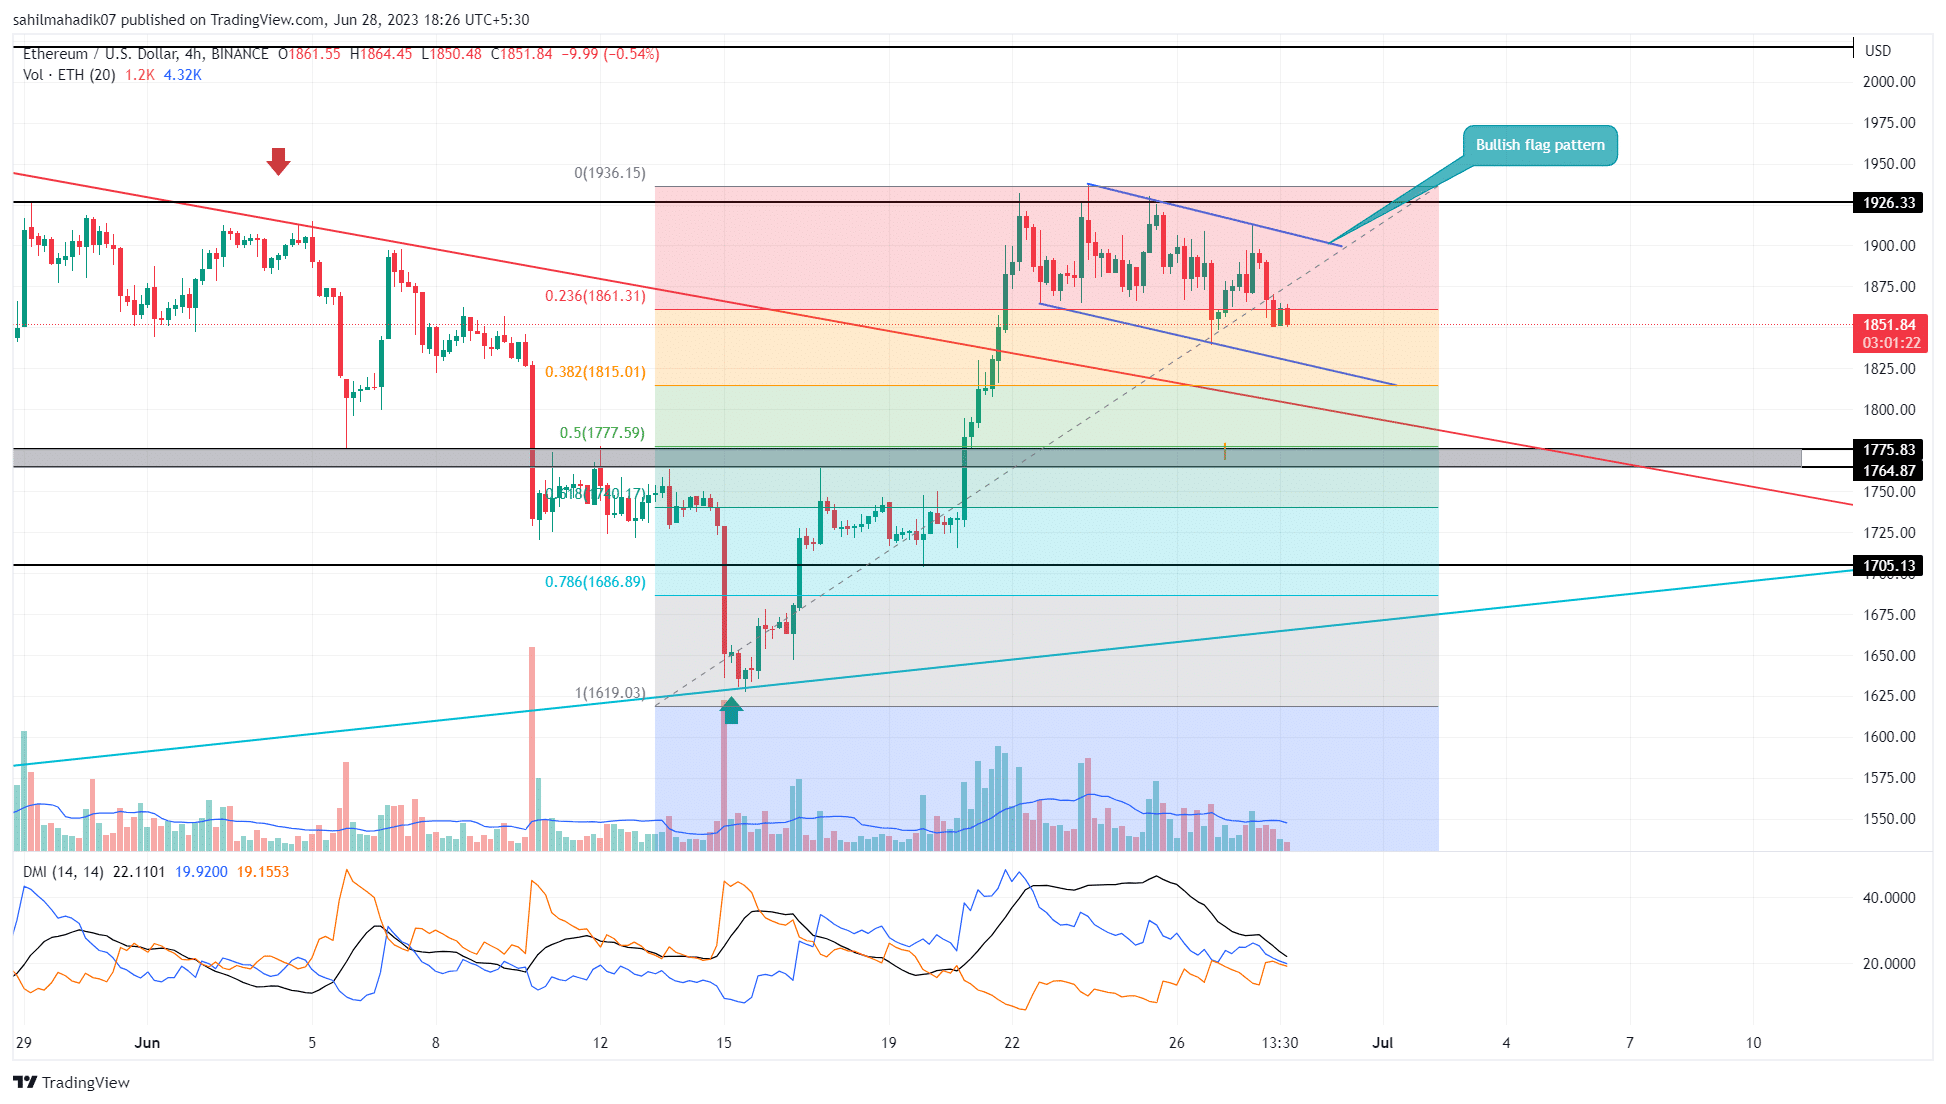
For nearly a week, the Ethereum coin price showed multiple failed attempts to surpass the $1920 resistance. The long-wick rejection candles reflect intense supply pressure from above. However, a look at the 4-hour time frame chart reveals the formation of a bullish continuation called Flag. In response to the chart pattern, the ETH price could witness a minor pullback before continuing with the bullish trend.
Also Read: Ethereum (ETH) Price Can Surge to $2750 If It Breaks This Supply Wall
Ethereum Price Daily Chart
- Flag pattern breakout could replenish the bullish momentum in the Ethereum price
- A bullish crossover between the 20-and-50-day EMA could increase the buying pressure in the market
- The intraday trading volume in Ether is $7.6 Billion, indicating a 9.5% loss.
Under the influence of a bullish flag, the Ethereum price shows a minor pullback from the $1920 resistance. However, this downfall strictly resonates between two downsloping trendlines which can be used to follow the current correction phase.
By press time, the Ethereum price traded at $1860 with an intraday loss of 1.51%. The potential traders looking for a long opportunity must wait for a bullish breakout above the overhead trendline which will be the key signal for uptrend continuation.
This post-breakout rally could drive the 8.6% rise to hit the next significant resistance of $2020.
Can Ethereum Price Revisit $2130?
In theory, the bullish continuation pattern offers a brief pullback to replenish the exhausted bullish momentum. As the build-up selling pressure gets absorbed, the buyers retake trend control and breach the overhead trendline. This breakout will intensify the bullish momentum and offer an entry opportunity for traders. The potential rally could hit the first target of $2020, followed by $2130.
- DMI: A potential bearish crossover between the DI+ and DI- could prolong a bearish retracement.
- Fibonacci Retracement levels: The current correction phase stays above the 50% FIB level indicating the overall market sentiment remained bullish.
Recent Posts
- Price Analysis
Pi Coin Price Prediction as Expert Warns Bitcoin May Hit $70k After BoJ Rate Hike
Pi Coin price rose by 1.05% today, Dec. 18, mirroring the performance of Bitcoin and…
- Price Analysis
Cardano Price Outlook: Will the NIGHT Token Demand Surge Trigger a Rebound?
Cardano price has entered a decisive phase as NIGHT token liquidity rotation intersects with structural…
- Price Analysis
Will Bitcoin Price Crash to $74K as Japan Eyes Rate Hike on December 19?
Bitcoin price continues to weaken after breaking below its recent consolidation range, now trading within…
- Price Analysis
Bitwise Predicts Solana Price Will Hit New All-Time Highs in 2026
Solana price declined by 4% over the past 24 hours, breaking below the key $130…
- Price Analysis
Bitcoin Price Outlook: Capriole Founder Warns of a Drop Below $50K by 2028
Bitcoin price narratives continue to evolve as long-term downside risks regain attention. Bitcoin price discussions…
- Price Analysis
XRP Price Rare Pattern Points to a Surge to $3 as ETFs Cross $1B Milestone
XRP price dropped by 1.2% today, Dec. 17, continuing a downward trend that started in…