Ethereum Price Retest $1,600 Amid Low Volatility; A Bull’s Trap?


Ethereum price retested $1,600 in today’s session. However, investors don’t seem to be convinced of the move as the formation of the Doji candlestick indicates. The market is still in confusion to continue to move higher or take a U-turn from here.
The $1,590- $1,600 remains a crucial price zone to trade since July 20. After breaching the zone, ETH tested swing highs of $2,031.39, but immediately retraced back and dropped to the lows of $1,420.
- Ethereum price looks stable near $1,600 on Tuesday.
- As long the price manages to stay above $1,550 bulls will be in the game.
- However, if the price confirms an evening star pattern on the daily chat, a new round of selling could be expected.
Ethereum price turns hostile
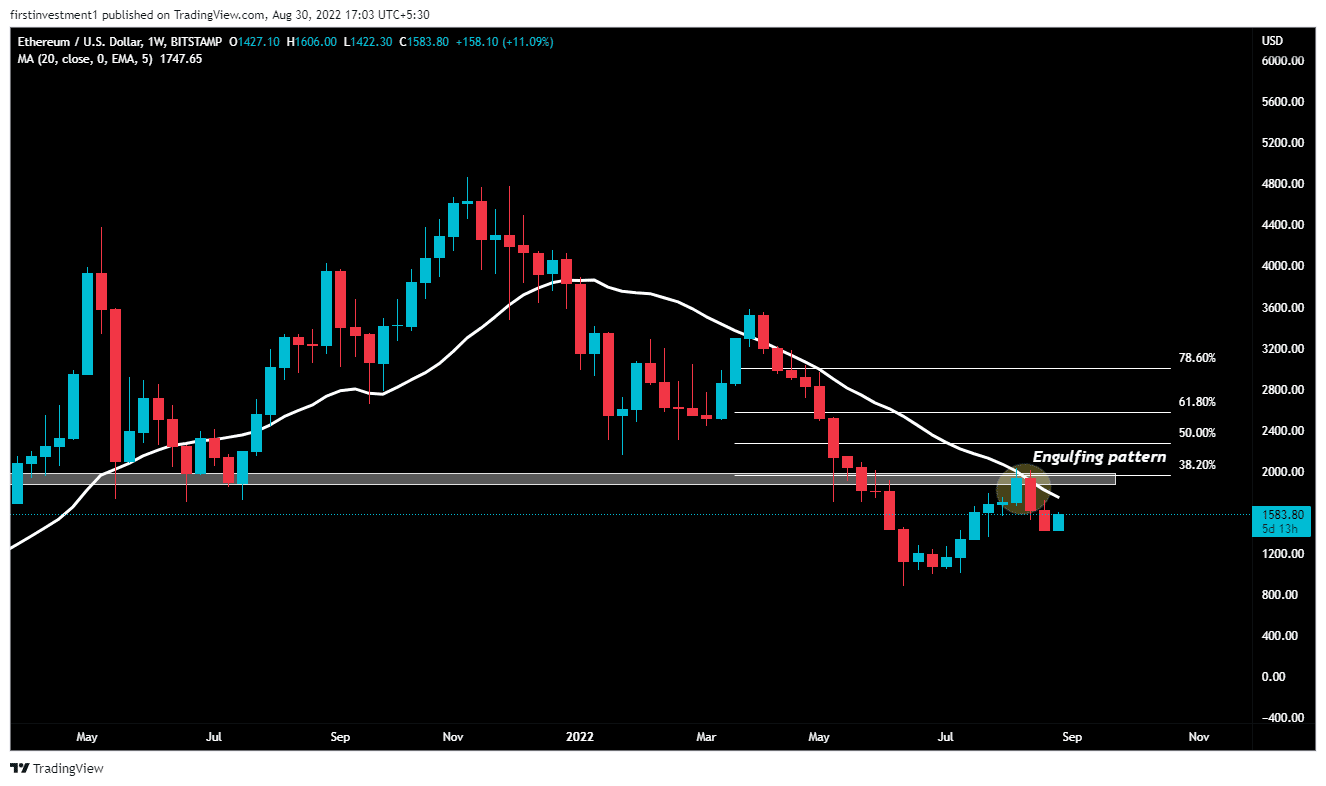
On the weekly chart, ETH gave a breakdown of a bearish Engulfing pattern. A bearish engulfing pattern produces the strongest signal when it appears at the tip of an uptrend. during this pattern, the Reed candle engulfs the previous (smaller) green candle & appears at the highest of an uptrend.
Since bearish engulfing candles can indicate the start of a chronic downtrend, it’s helpful to contemplate an initial take profit level while remaining hospitable to further downward movement. Adjust stops accordingly or think about employing a trailing stop.
Ethereum price faces resistance at the 20-day exponential moving average, along with a 38.6% Fibonacci retracement, which will act as immediate resistance for this week.
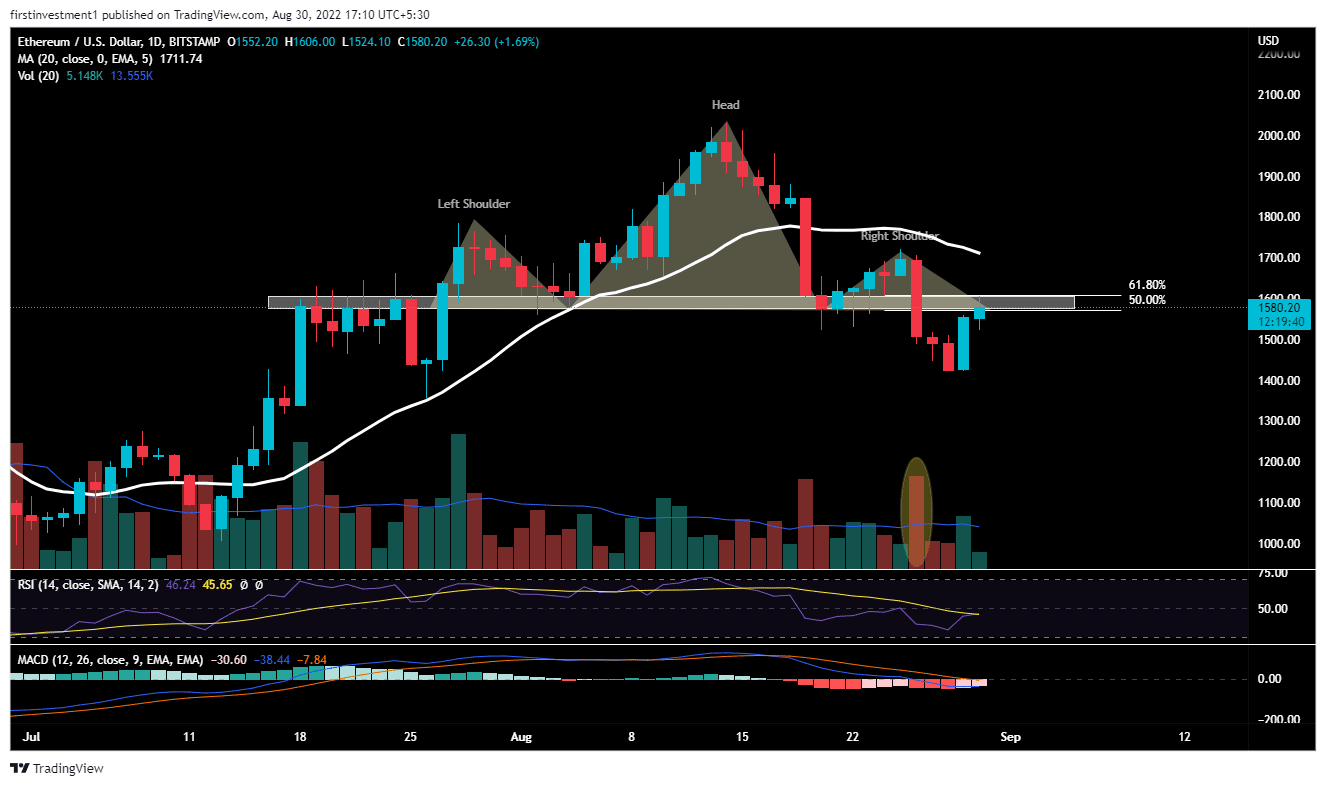
On the daily chart, further, ETH gives a breakout of the “Head & Shoulder” pattern, breaking down the neckline support, with rising volumes. The neckline of support is between $1,575 to $1,608. ETH/USD faces heavy resistance at the pattern’s neckline as well as at the 61.8% Fibonacci retracement. If the price sustains below this given level, then there is a higher chance of moving towards $1400.
Also read: https://This Technical Chart Shows ETH Can Drop to $1,000 Again
The RSI (14) is trading below 50. When the relative strength index is below 50, it generally means that the losses are greater than the gains. Whereas, the MACD line crosses below the signal line below zero, indicating a bearish trend.
The nearest support is $1,480, whereas the nearest resistance is $1,600. There is a higher probability of the price to breaks its support level. “Sell on rising” opportunity is the best course of plan we can go with.
On the other hand, a daily candlestick above $1,600 could invalidate the bearish outlook. And the bulls could recapture the $1,700 mark.
ETH is bearish on all time frames. Below $1,480 closing on the hourly time frame, we can put a trade on the sell side.

Why Trust CoinGape
CoinGape has covered the cryptocurrency industry since 2017, aiming to provide informative insights Read more…to our readers. Our journal analysts bring years of experience in market analysis and blockchain technology to ensure factual accuracy and balanced reporting. By following our Editorial Policy, our writers verify every source, fact-check each story, rely on reputable sources, and attribute quotes and media correctly. We also follow a rigorous Review Methodology when evaluating exchanges and tools. From emerging blockchain projects and coin launches to industry events and technical developments, we cover all facets of the digital asset space with unwavering commitment to timely, relevant information.

Related Articles


- Wells Fargo Predicts Bitcoin Rally on $150 Billion ‘YOLO Trade’ Inflow
- Will Crypto Market Crash as U.S.–Iran War Reportedly Imminent?
- Bitcoin Quantum Threat: CryptoQuant’s CEO Flags Risk of Losing Satoshi’s 1M BTC Stash to Hackers
- Crypto Regulation: Hyperliquid Launches Policy Group to Push DeFi Integration in U.S. Markets
- XRP News: XRPL Activates Permissioned DEX Upgrade to Boost Institutional DeFi Adoption
- BMNR Stock Outlook: BitMine Price Eyes Rebound Amid ARK Invest, BlackRock, Morgan Stanley Buying
- Why Shiba Inu Price Is Not Rising?
- How XRP Price Will React as Franklin Templeton’s XRPZ ETF Gains Momentum
- Will Sui Price Rally Ahead of Grayscale’s $GSUI ETF Launch Tomorrow?
- Why Pi Network Price Could Skyrocket to $0.20 This Week
- Pi Network Price Beats Bitcoin, Ethereum, XRP as Upgrades and Potential CEX Listing Fuels Demand


