Ethereum Price Return to $1800? Fake Breakout Triggers Concerns of Minor Correction
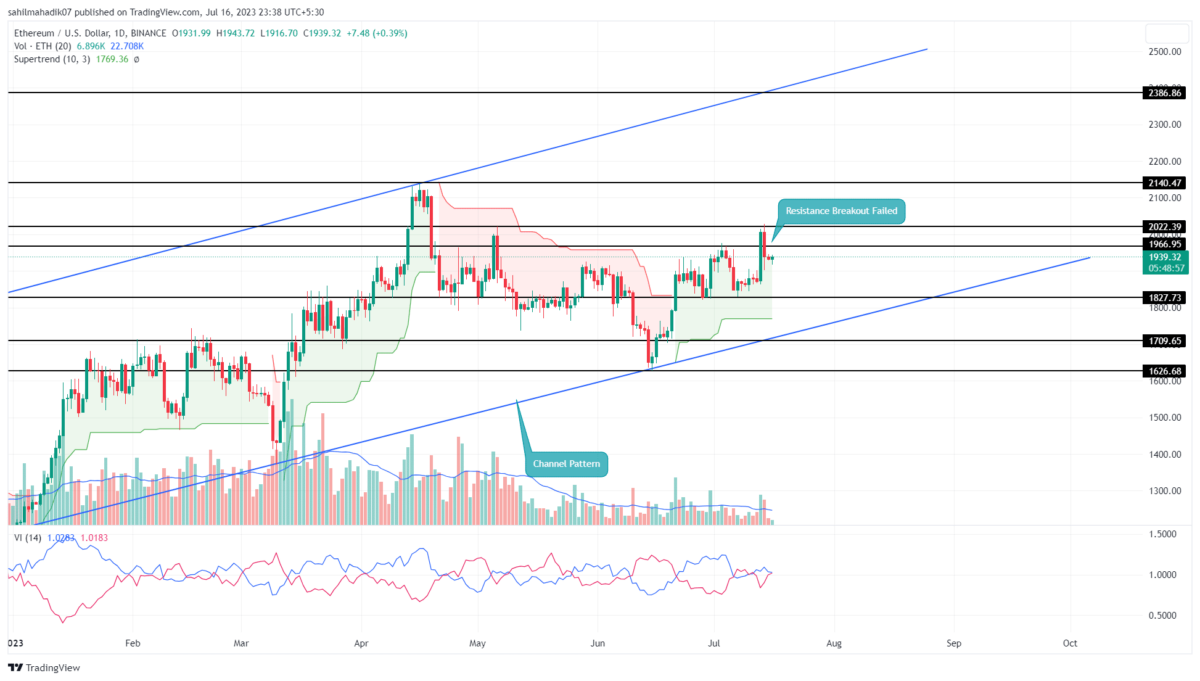
Ethereum Price Analysis: On July 13, the Ethereum coin price breached a weekly resistance of $1966 as a signal of uptrend continuation. However, the coin price faced immediate supply pressure at $$2000 psychological resistance and plunged below 1966. This failed breakout suggests the recent rally was driven by market sentiment and not by the coin’s own strength. Thus, the ETH price could witness a minor pullback before resuming the recovery trend.
Also Read: Bitcoin (BTC) and Ethereum (ETH) Show Bullish Divergence As Per NRPL Indicator, Rally Ahead?
Ethereum Price Daily Chart
- The $2000 stands in a strong resistance zone against buyers
- The rising channel pattern maintains the long-term bull trend in the ETH price
- The intraday trading volume in Ether is $134 Billion, indicating a 134% gain.
The Ethereum price failure to sustain $1966 must have trapped the hasty buyers who entered the breakout traders. Such bull traps are strong bearish signals as the price usually forces the liquidation of the trapped buyers and brings more selling orders into the market.
By the press time, Ethereum price traded at $1940 with an intraday of 0.43%. If the selling pressure persists, the coin price tumble 7.5% to retest a local support of $1830. Over the past three weeks, this support has offered a dip opportunity to buyers and maintained a recovery rally.
In addition, the ETH price is still in a higher high and higher low state, indicating the bullish trend is intact.
[converter id=”eth-ethereum” url=”https://coingape.com/price/converter/eth-to-usd/?amount=1″]
Will ETH Price Rise to $2400?
The rising channel pattern currently governs the bullish trend in the Ethereum price. The support trendline of this pattern is a suitable level to accumulate and lose the neckline to change sentiment if sellers breached below. Under the influence of this pattern, the current recovery cycle is likely to hit the overhead trendline that is near the $2400 mark.
- Vortex indicator: A possible bearish crossover between the VI+(blue) and Vl(orange)- slope reflects a loss in bullish momentum.
- Super Trend: The green film accentuates the overall market trend is bullish
Recent Posts
- Price Analysis
Pi Coin Price Prediction as Expert Warns Bitcoin May Hit $70k After BoJ Rate Hike
Pi Coin price rose by 1.05% today, Dec. 18, mirroring the performance of Bitcoin and…
- Price Analysis
Cardano Price Outlook: Will the NIGHT Token Demand Surge Trigger a Rebound?
Cardano price has entered a decisive phase as NIGHT token liquidity rotation intersects with structural…
- Price Analysis
Will Bitcoin Price Crash to $74K as Japan Eyes Rate Hike on December 19?
Bitcoin price continues to weaken after breaking below its recent consolidation range, now trading within…
- Price Analysis
Bitwise Predicts Solana Price Will Hit New All-Time Highs in 2026
Solana price declined by 4% over the past 24 hours, breaking below the key $130…
- Price Analysis
Bitcoin Price Outlook: Capriole Founder Warns of a Drop Below $50K by 2028
Bitcoin price narratives continue to evolve as long-term downside risks regain attention. Bitcoin price discussions…
- Price Analysis
XRP Price Rare Pattern Points to a Surge to $3 as ETFs Cross $1B Milestone
XRP price dropped by 1.2% today, Dec. 17, continuing a downward trend that started in…