FIL Price Analysis: Filecoin Preparing its Next Jump with a Pennant Pattern


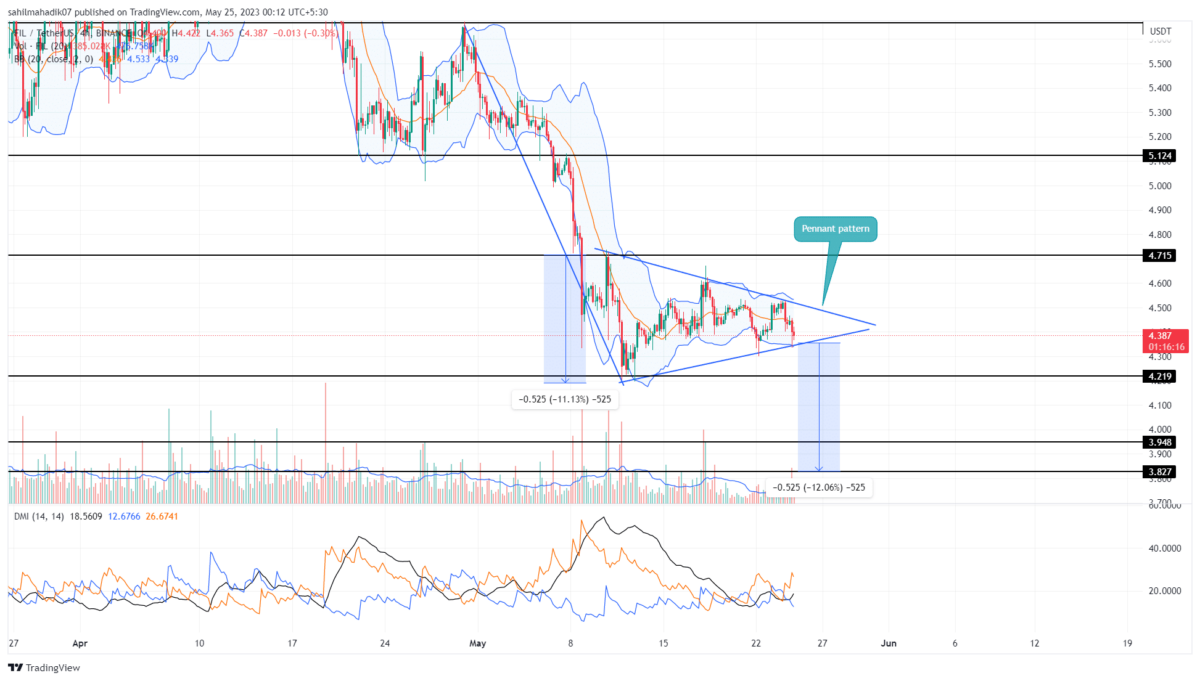
For nearly three weeks, the FIL price has been wavering in a no-trading zone, following the consolidation phase of the pennant pattern. Today, the coin price shows a 2.6% jump and rechallenges the overhead trendline. However, a daily candlestick closing above the trendline is needed to end this consolidation.
Key points:
- Completion of the pennant pattern will bring a direction rally in FIL
- The 20-day EMA flipped to a viable support level
- The intraday trading volume in Filecoin is $427.6 Million, indicating a 28.6% gain
 Source- Tradingview
On July 26th, the FIL/USDT pair rebounded from the $5-$5.1 support and triggered perpendicular growth that hit the $11.24 mark. The sudden recovery registered a 117% growth in just a week.
However, the FIL price couldn’t sustain at these higher prices for long as profit booking from short-term traders triggered a minor correction. Following the pullback, the altcoin walks a later path within two converging trend lines, presenting a series of narrow peaks and troughs.
Such consolidation after a price jump indicates the formation of a pennant pattern. The FIL price resonated within this pattern for more than two weeks, gradually nearing its peak. Though the price spread has shrunk enough to be considered a no-trading zone, it also suggests the altcoin may soon give a decisive breakout.
In theory, this bullish breakout from this continuation pattern’s resistance trendline will provide the target of some distance as that of the pole. Thus the resulting may surge the altcoin 56% higher to hit $13.5.
Conversely, an unlikely yet possible breakdown from the support trendline will offset the bullish thesis and trigger a considerable correction. This retracement would slum the altcoin to $6.32 support.
Technical indicator
EMAs: the coin price trading within a short range formed by the flattened 20-and-100-day Ema. A breakout from either level will give an extra edge on the respective side.
RSI Indicator: despite a nearly three-week correction, the RSI slope sustains above the midline, indicating bullish market sentiment.
- Resistance levels- $9.8-9.5, and $12
- Support levels- $8 and $7.1

Why Trust CoinGape
CoinGape has covered the cryptocurrency industry since 2017, aiming to provide informative insights Read more…to our readers. Our journal analysts bring years of experience in market analysis and blockchain technology to ensure factual accuracy and balanced reporting. By following our Editorial Policy, our writers verify every source, fact-check each story, rely on reputable sources, and attribute quotes and media correctly. We also follow a rigorous Review Methodology when evaluating exchanges and tools. From emerging blockchain projects and coin launches to industry events and technical developments, we cover all facets of the digital asset space with unwavering commitment to timely, relevant information.

Related Articles


- CLARITY Act: White House to Hold Another Meeting as Crypto and Banks Stall on Stablecoin Yield Deal
- Bitcoin as ‘Neutral Global Collateral’? Expert Reveals How BTC Price Could Reach $50M
- XRP Ledger Validator Spotlights Upcoming Privacy Upgrade as Binance’s CZ Pushes for Crypto Privacy
- Harvard Management Co (HMC) Cuts BlackRock Bitcoin ETF Exposure by 21%, Rotates to Ethereum
- Morgan Stanley, Other TradFi Load Up SOL as Solana RWA Tokenized Value Hits $1.66B ATH
- Ethereum Price Outlook as Harvard Shifts Focus from Bitcoin to ETH ETF
- HOOD and COIN Stock Price Forecast as Expert Predicts Bitcoin Price Crash to $10k
- XRP Price Prediction Ahead of Supreme Court Trump Tariff Ruling
- Crypto Price Prediction For This Week: Dogecoin, Solana and Cardano
- Bitcoin Price Prediction: How Could Brazil’s Strategic Bitcoin Reserve Proposal Impact BTC?
- 3 Top Reasons Pi Network Price Surging Today (14 Feb)


