Hedera Price Analysis: Bullish Reversal From Support Sparks 24% Recovery Rally
A bullish reversal from the support trendline hints HBAR price to prolong the recovery trend. Defying the broader market bearishness, the Hedera Hashgraph shows a strong rebound from the ascending support trendline and maintaining its overall bullish outlook. Over the past two months, the crypto buyers have obtained dynamic support from this trendline offering an opportunity to accumulate at dips. Should you buy this altcoin despite bearish winds?
Also Read: HBAR On The Rise? Why Bone ShibaSwap And Everlodge Are Still Winning Hearts
HBAR Price Chart: Key Points
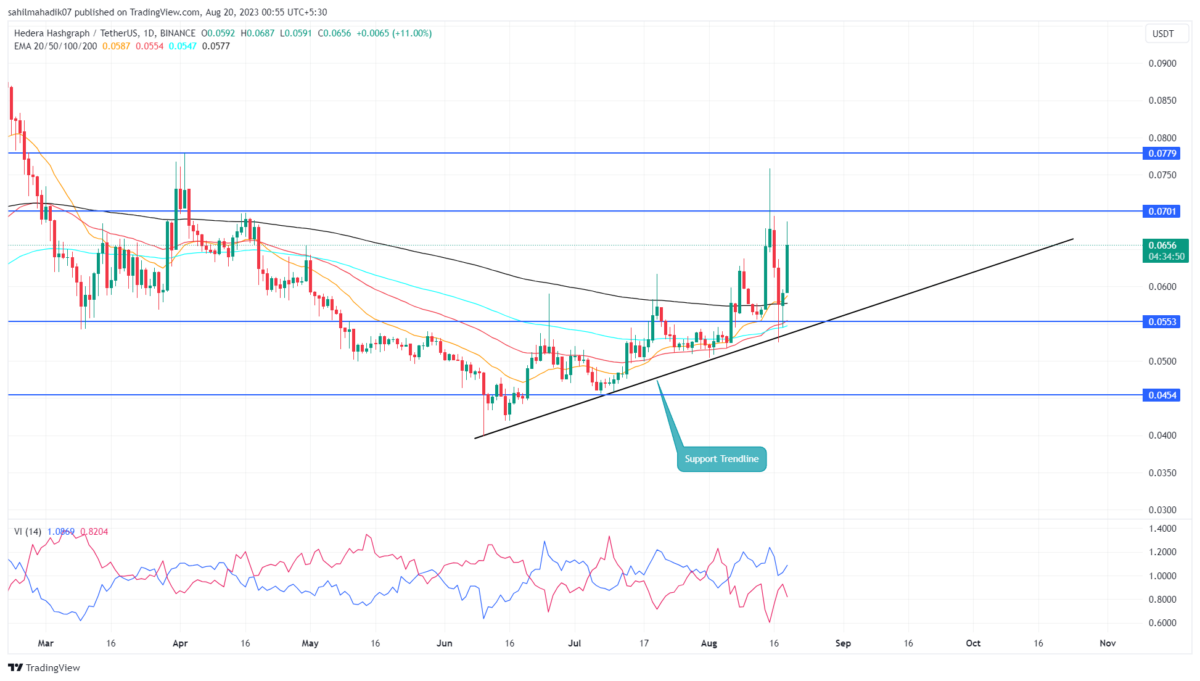
- An ascending trendline governs the current recovery rally in the Hedera hashgraph.
- A golden crossover between 50-and-200-day EMA encourages buyers for extending the recovery rally
- The intraday trading volume in the HBAR is $236.2 Million, indicating a 131% gain.
Amid the rising bearishness in the crypto market, HBAR recovery rally entered a correction mode after reaching a high of $0.0759. This pullback tumbled the prices by 30% and retested the two-month-long support trendline.
Despite the negative sentiment in the market, Hedera Hashgraph buyers gave a strong rebound, signaling the buyers continue to accumulate this asset at dips, which is a sign of an established uptrend. So far the bullish swing recovered 24% reaching the current trading value of $0.0656.
With sustained buying, the coin price could rise to potential targets of $0.7, followed by $0.78, and $0.988.
Is HBAR Price Still Under Correction Threat?
The daily time frame chart shows the Hedera coin may prolong the current recovery cycle until the ascending support trendline is intact. With each pullback to this trendline, interested buyers can look for entry opportunities, however, considering a pessimistic approach, if sellers breach the lower trendline, the aforementioned bullish thesis will get invalidated. This breakdown could push the prices to $0.45 local support.
- Exponential Moving Average: The HBAR price sustainability above the 200-day EMA reflects the overall trend as bullish.
- Vortex Indicator: A positive crossover state between the VI+(blue) and VI-(orange) indicates the market trend supports recovery
Recent Posts
- Price Analysis
Will Solana Price Hit $150 as Mangocueticals Partners With Cube Group on $100M SOL Treasury?
Solana price remains a focal point as it responds to both institutional alignment and shifting…
- Price Analysis
SUI Price Forecast After Bitwise Filed for SUI ETF With U.S. SEC – Is $3 Next?
SUI price remains positioned at a critical intersection of regulatory positioning and technical structure. Recent…
- Price Analysis
Bitcoin Price Alarming Pattern Points to a Dip to $80k as $2.7b Options Expires Today
Bitcoin price rebounded by 3% today, Dec. 19, reaching a high of $87,960. This rise…
- Price Analysis
Dogecoin Price Prediction Points to $0.20 Rebound as Coinbase Launches Regulated DOGE Futures
Dogecoin price has gone back to the spotlight as it responds to the growing derivatives…
- Price Analysis
Pi Coin Price Prediction as Expert Warns Bitcoin May Hit $70k After BoJ Rate Hike
Pi Coin price rose by 1.05% today, Dec. 18, mirroring the performance of Bitcoin and…
- Price Analysis
Cardano Price Outlook: Will the NIGHT Token Demand Surge Trigger a Rebound?
Cardano price has entered a decisive phase as NIGHT token liquidity rotation intersects with structural…