Here’s How Descending Triangle Pattern Limits The Solana Coin Recovery
The daily technical chart shows the Solana coin price is in a short-term range-bound rally. Furthermore, this sideways is restricted within the top resistance of $47.4 and bottom support of $26. The coin holders should keep a keen eye on these levels as they will have a significant impact in the near term future.
Key points Solana coin analysis:
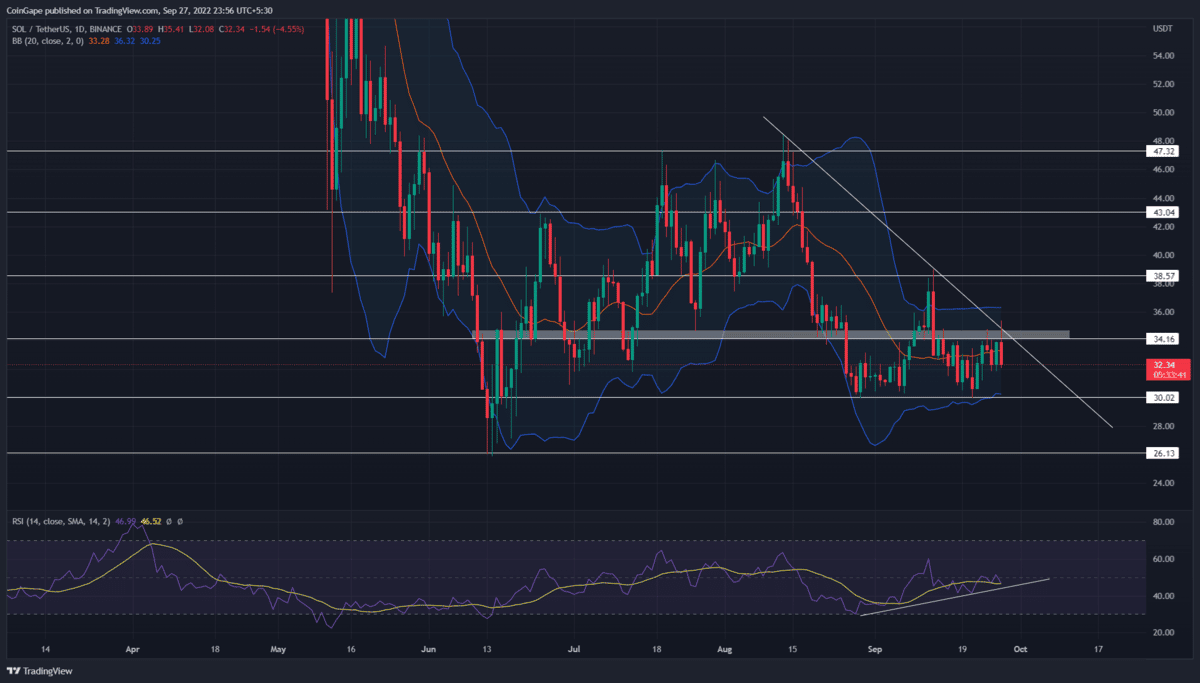
- The high wick rejection candles at $34.1 validate it as a strong supply zone
- The Solana price will continue its downward spiral until the resistance trendline is intact
- The 24-hour trading volume in the Solana coin is $1.2 Billion, indicating a 42% gain
The ongoing bear cycle within the aforementioned range has revealed a descending triangle pattern formation. In theory, this bearish continuation pattern triggers a significant boost in selling pressure once the coin price breaks below its neckline support.
Concerning this pattern, the Solana coin chart shows the $30 as the neckline support and a descending trendline as a dynamic resistance. Earlier today, the altcoin showcased a 4% gain and tried to break the $34.5 resistance.
However, the descending trendline intersected at the same level, creating a strong resistance zone for buyers. Moreover, the crypto market faces sudden selling pressure and evaporates the entire intraday gains.
The Solana coin price is currently trading at the $32.84 mark, with a 3.04% loss from yesterday’s closing.
Thus, a strong rejection candle formed at $34.5 resistance indicates the coin price is likely to tumble 9% lower to hit the $30 support. Under the influence of this pattern, the SOL price should eventually break the neckline support and carry the downfall another 12.5% down to reach the June low support of $26.
On a contrary note, a possible breakout from the resistance trendline will indicate a switch in market sentiment and an opportunity for price recovery.
Technical indicator
RSI: the daily-RSI slope shows an evident bullish divergence concerning the price restest to the $30 support. This divergence strengthens the possibility of a bullish recovery.
Bollinger band indicator: the coin price nosedive below the indicator midline indicates the sellers will remain in charge of price behavior.
- Resistance level- $34.5 and $38.5
- Support levels- $30 and $26
Recent Posts
- Price Analysis
Pi Network Analysis: Pi Coin Price Surges on Christmas Eve, Can It Hit Year-End Highs?
Pi coin price reflect cautious positioning as market structure tightens near a key base. The…
- Price Analysis
Why Dec 26th Is A Do Or Die for Bitcoin Price Ahead Of Record Options Expiry?
As Christmas winds down, the Bitcoin price dipped 0.74% to around $86,750. Market participants…
- Price Analysis
Why Bitcoin, Ethereum And XRP Prices Are Down Today? (24 Dec)
The crypto market extended losses ahead of Christmas as Bitcoin, Ethereum, and XRP slipped further…
- Price Analysis
XRP Price Prediction: Will 4 Billion Transactions Spark Next Rally?
XRP price trades below the $2 mark after the latest correction across the broader cryptocurrency…
- Price Analysis
Solana Price Outlook: Will SOL Recover With Strong Institutional Buying?
Solana price remains steady above the $120 support after the recent crypto market pullback. The…
- Price Analysis
Ethereum Price Risks Crash to $2,500 Amid Sustained Wintermute Dumping
Ethereum price dropped below the key support at $3,000 on Tuesday, down by ~40% from…