Here’s Shiba Inu Price Analysis Guide For The Coming Week


The Shiba Inu price has been stuck in a consolidation phase for the past three weeks. Despite multiple attempts to break this range in a volatile market, it indicates indecisiveness among market participants. However, the current price action shows reversal signs from $0.0000089 support, suggesting a 5% upswing to reach the $0.00000964 mark.
Key points:
- The lower price rejection candle at $0.0000089 reflects the traders are actively buying at this support.
- The Shiba Inu coin will remain trapped in a sideways trend until the price break beyond the range.
- The intraday trading volume of the Shiba Inu coin is $171.2 Million, indicating a 60% loss.
Whales buying despite staggered Shiba Inu price action
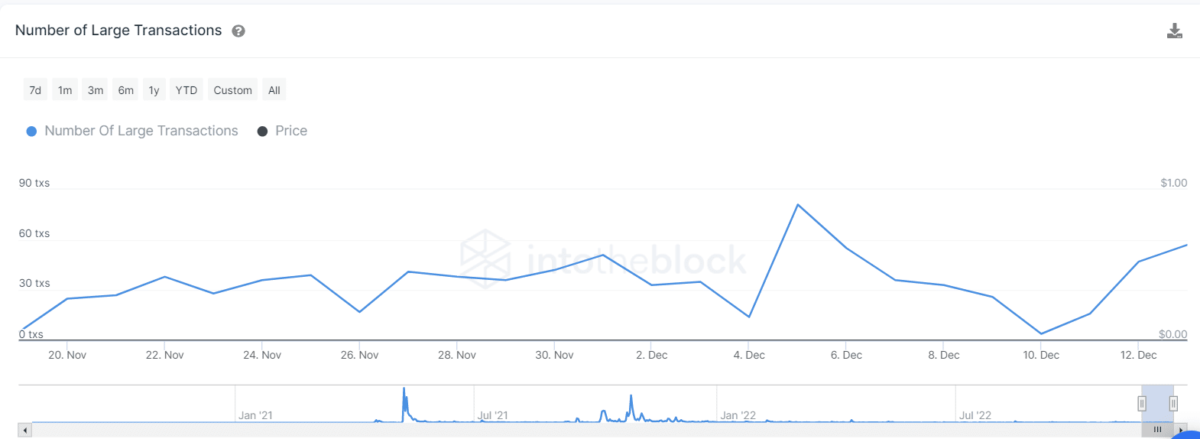 Source- Intotheblock
Intotheblock, the on-chain data provider, shows steady growth in whale accumulation from Dec 10th. This metric of Large transactions measures the transaction having a value greater than $100,000, trying to understand what the big players of the market are doing.
In the last 24hrs, the number of large transactions hit 57, the highest in the last seven days. Thus, the whales could be buying despite the sluggish and decreasing SHIB price, indicating they still believe in its potential growth.
Price Analysis
 Source- Tradingview
The Shiba Inu coin price is currently moving in a short-term sideways trend. Its been a month since this memecoin has been wavering between $0.00000964 and $0.0000084, creating a narrow price range. In addition, the SHIB price displayed a sequence of green and red candles indicating indecisiveness among market participants.
Furthermore, on December 12th and 13th, this altcoin witnessed huge volatility and tried to breach the lower support of $0.00000893. However, both the daily candle ended up closing above the $0.00000893 mark, suggesting the buyers are actively defending this level.
With this rejection, the Shiba Inu coin has a higher possibility for a bullish reversal. This reversal hints at a prolonged consolidation and may drive the 5% higher to $0.000009654
Anyhow, new trades looking for entry opportunities should grab a breakout signal from the range barriers.
Technical indicator
Relative strength index: the RSI indicator, which reflects the strength of recent price action, indicates a bearish outlook as its daily-slope wavers below the neutral line.
EMAs: the falling EMAs(20, 50, 100, and 200) indicate an overall downtrend. Moreover, the 20-and-50-day slope acts as a dynamic resistance for any potential bullish pullback.
- Resistance levels- $0.0000125 and $0.000015
- Support levels: $0.00000096 and $0.00000104

Why Trust CoinGape
CoinGape has covered the cryptocurrency industry since 2017, aiming to provide informative insights Read more…to our readers. Our journal analysts bring years of experience in market analysis and blockchain technology to ensure factual accuracy and balanced reporting. By following our Editorial Policy, our writers verify every source, fact-check each story, rely on reputable sources, and attribute quotes and media correctly. We also follow a rigorous Review Methodology when evaluating exchanges and tools. From emerging blockchain projects and coin launches to industry events and technical developments, we cover all facets of the digital asset space with unwavering commitment to timely, relevant information.

Related Articles


- U.S. CPI Release: Wall Street Predicts Soft Inflation Reading as Crypto Market Holds Steady
- Bhutan Government Cuts Bitcoin Holdings as Standard Chartered Predicts BTC Price Crash To $50k
- XRP News: Binance Integrates Ripple’s RLUSD on XRPL After Ethereum Listing
- Breaking: SUI Price Rebounds 7% as Grayscale Amends S-1 for Sui ETF
- Bitget Targets 40% of Tokenized Stock Trading by 2030, Boosts TradFi with One-Click Access
- Cardano Price Prediction Ahead of Midnight Mainnet Launch
- Pi Network Price Prediction as Mainnet Upgrade Deadline Nears on Feb 15
- XRP Price Outlook Amid XRP Community Day 2026
- Ethereum Price at Risk of a 30% Crash as Futures Open Interest Dive During the Crypto Winter
- Ethereum Price Prediction Ahead of Roadmap Upgrades and Hegota Launch
- BTC Price Prediction Ahead of US Jobs Report, CPI Data and U.S. Government Shutdown


