Here’s Why Ethereum Could Rally 10% Before Continuing Its Downfall
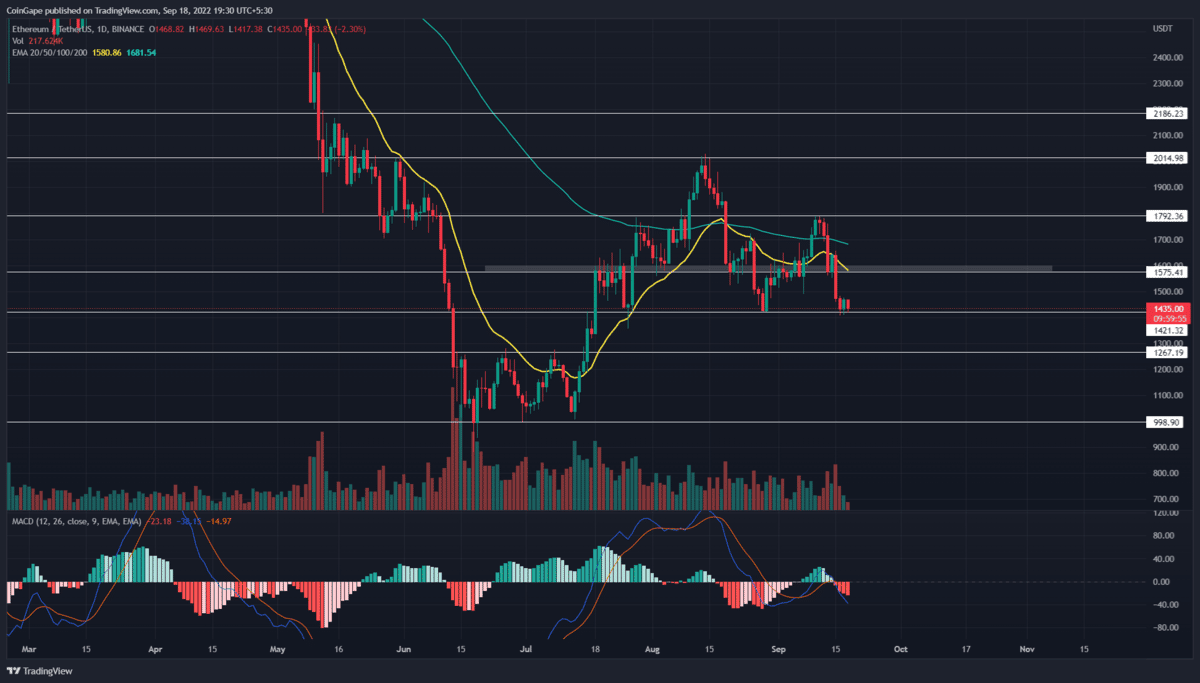
The recent widespread correction in the crypto market reverted the Ethereum price from $1800 resistance. This sell-off entirely evaporated the early September recovery and plunged the prices back to the monthly support zone of $1420. However, the price action shows reversal signs at this support, indicating a possible relief rally.
Key points:
- The coin chart shows the formation of a double bottom pattern in the 4-hour time frame chart.
- Losing the $1420 could plummet the Ethereum price bac
- The intraday trading volume in Ethereum is $10.65 Billion, indicating a loss of 12.2%.
Furthermore, it’s been three days since the sellers are wrestling buyers at this support to prolong this correction. Furthermore, with a 2.575% loss, the Ethereum price is painted red today and retests the $1420 support.
If the sellers manage a daily candle closing below the aforementioned support, the accelerated selling pressure will plunge the altcoin to $1000 psychological support.
Ethereum Could Rally With This Double Bottom Pattern
The four-time chart shows a lower price rejection candle at the $1420 support indicating the traders are actively buying at this level. Moreover, the RSI indicator displaying bullish divergence to base support indicates a better possibility for price reversal.
If this theory worked out, the Ethereum price could rally 3.88% higher to challenge the $1470 neckline of double bottom pattern. A bullish breakout from this resistance will further encourage buying activity and retest the $1575 supply zone.
Anyhow, the price action at this level is crucial to influence future Ethereum prices.
Due to the accumulation of daily EMAs at this level, a possible reversal could display a lower high in the daily chart indicating a losing bearing momentum.
However, if the Ethereum price surpasses this level, it indicates the recent correction was just panic selling in the market.
Technical indicator-
Bollinger band: the falling Ethereum price retest the indicator’s band support. Such activity has previously resulted in a bullish reversal, bolstering the relief rally theory.
MACD indicator: A widespread between the bearishly aligned fast and slow line below the neutral zone indicates aggressive selling in the market.
- Resistance level- $1470 and $1520
- Support level- $1400 and $1362
Recent Posts
- Price Analysis
Bitcoin Price Eyes $100k as Core US Inflation Slips Ahead of CLARITY Act Markup
Bitcoin price held steady above the key resistance level at $92,000 as market participants reflected…
- Price Analysis
Why Is MSTR Stock Price Down Despite Recent Bitcoin Purchase
MSTR stock price has recently experienced a sharp decline, even though MicroStrategy (MSTR) has made…
- Price Analysis
Pi Coin Price Prediction: How Mainnet Migration and New Tokens Supply Could Affect Pi Network?
Pi Coin price continues to trade within a tight consolidation after an extended distribution phase,…
- Price Analysis
Crypto Stocks To Watch: MSTR, Metaplanet, and S&P 500 price
The stock market fluctuated on Tuesday as Wall Street digested news of a criminal investigation…
- Price Analysis
Solana Price Targets $200 as WisdomTree Declares Its Dominance Structural
Solana price continued its recovery today, January 12, continuing a trend that started in December…
- Price Analysis
Bitcoin Price Prediction Amid DOJ Probe as Powell Indictment Fears Cool
Bitcoin price continues to compress below key resistance as macro risk re-enters the equation. BTC…