 Buy $GGs
Here’s Why MATIC Buyers Hold Trend-Control Despite Today’s Sell-off


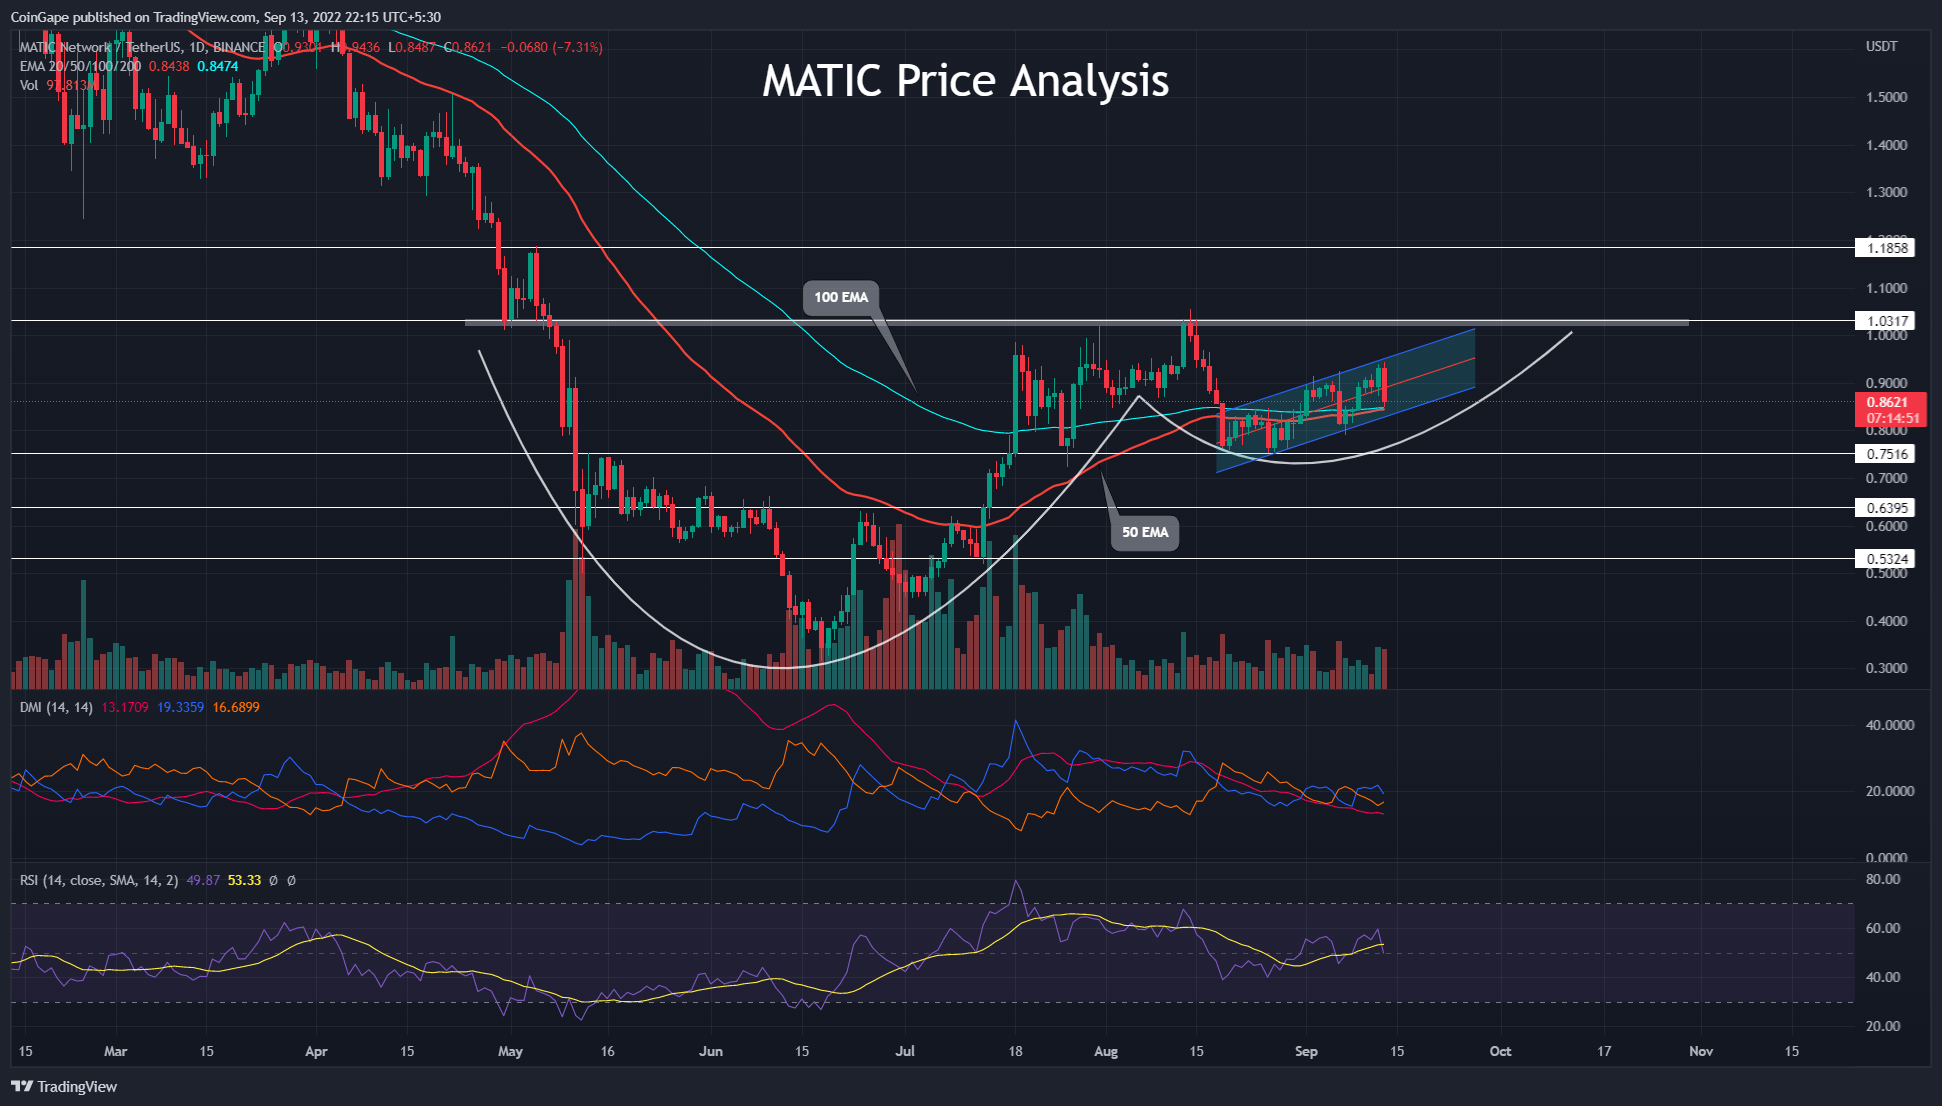
Despite being a bearish pattern, the rising parallel channel led the MATIC price to $1 resistance. Moreover, this resistance is the neckline of a cup and handle pattern holds significant weightage to determine the future market price. Thus, the coin holder should closely watch the price action near the $1 mark.
Key points from MATIC price analysis
- The support trendline carries the ongoing recovery in MATIC price
- The 50-and-100-day EMA on the verge of bullish crossover may attract more buyers to the market
- The intraday trading volume in the MATIC is $748.3 Million, indicating a 24.5% gain
 Source- –Tradingview
In late August, the MATIC prices took a bullish reversal from the $0.75 support level, resulting in a rising channel pattern, accounting for a 25% jump. As a result, the bull cycle beats the 50-and-100-day EMA but struggles to reach the psychological mark of $1.0.
Taking the larger picture into account, the price action reveals a cup and handle pattern in the daily chart with a neckline at the psychological mark of $1.0. The ongoing bull cycle projects the possibility of pattern completion, which may shortly result in a bullish breakout if the buying pressure sustains.
However, amid today’s sell-off, the MATIC price tumbled 7.3% and shows a bearish engulfing candle in the rising channel.
Coming to the intraday trading volumes, the bearish engulfing candle finds seller commitment, teasing a rising channel fallout. If the prices manage to close below the support trendline, MATIC traders can find a short-term selling opportunity with a target of the $0.75 support level. Furthermore, if the increased selling pressure breaks the $0.75 level, a prolonged correction might test the psychological mark of $0.50.
However, an uptrend continuation reaching the psychological mark of $1.0 will increase the breakout possibility. And the unleashed bullish momentum upon successful breakout can test the overhead resistance of $1.30, accounting for a 30% jump.
Technical Indicators
DMI: due to the recent sell-off, the DI lines reverse sharply, indicating a bearish crossover possibility. And the falling adx line maintains the signal of weak Trend momentum.
Relative Strength Index: A steady growth in daily-RSI slope dips to the halfway line cracking under the 14-day SMA. Hence the Technical indicators maintain a slightly bearish viewpoint for MATIC.
- Resistance levels- $1 and $1.18
- Support levels-
- $0.815 and $0.75
Play 10,000+ Casino Games at BC Game with Ease
- Instant Deposits And Withdrawals
- Crypto Casino And Sports Betting
- Exclusive Bonuses And Rewards


Why Trust CoinGape
CoinGape has covered the cryptocurrency industry since 2017, aiming to provide informative insights Read more…to our readers. Our journal analysts bring years of experience in market analysis and blockchain technology to ensure factual accuracy and balanced reporting. By following our Editorial Policy, our writers verify every source, fact-check each story, rely on reputable sources, and attribute quotes and media correctly. We also follow a rigorous Review Methodology when evaluating exchanges and tools. From emerging blockchain projects and coin launches to industry events and technical developments, we cover all facets of the digital asset space with unwavering commitment to timely, relevant information.

Related Articles


- BTC Price Bounces as Spot Investors Buy The Dip Amid Iran War Jitters
- CFTC Chief Mike Selig Signals US Crypto Perpetual Futures Rollout in Coming Weeks
- Fed Rate Cut Odds Drop as Inflation Fears Rise Due To U.S. Iran Conflict
- Here’s Why Tether Gold (XAUt) Price Is Falling Even With Growing Gold Demand
- XRP News: Ripple Expands Payments Platform To Unify Fiat and Stablecoins Globally
- Gold Price Prediction March 2026: Rally, Crash, or Record Highs?
- RIOT Stock Prediction as Needham, Piper Sandler Slash Target After Earnings
- Cardano Price Outlook As Charles Hoskinson Warns Over CLARITY Act
- Circle Stock Price Climbs 15% to $96, Can Rally Continue in March 2026?
- Bitcoin Price Prediction as US-Iran War Enters 4th Consecutive Day
- Top 5 Historical Reasons Dogecoin Price Is Not Rising


