Here’s Why MATIC Buyers Hold Trend-Control Despite Today’s Sell-off
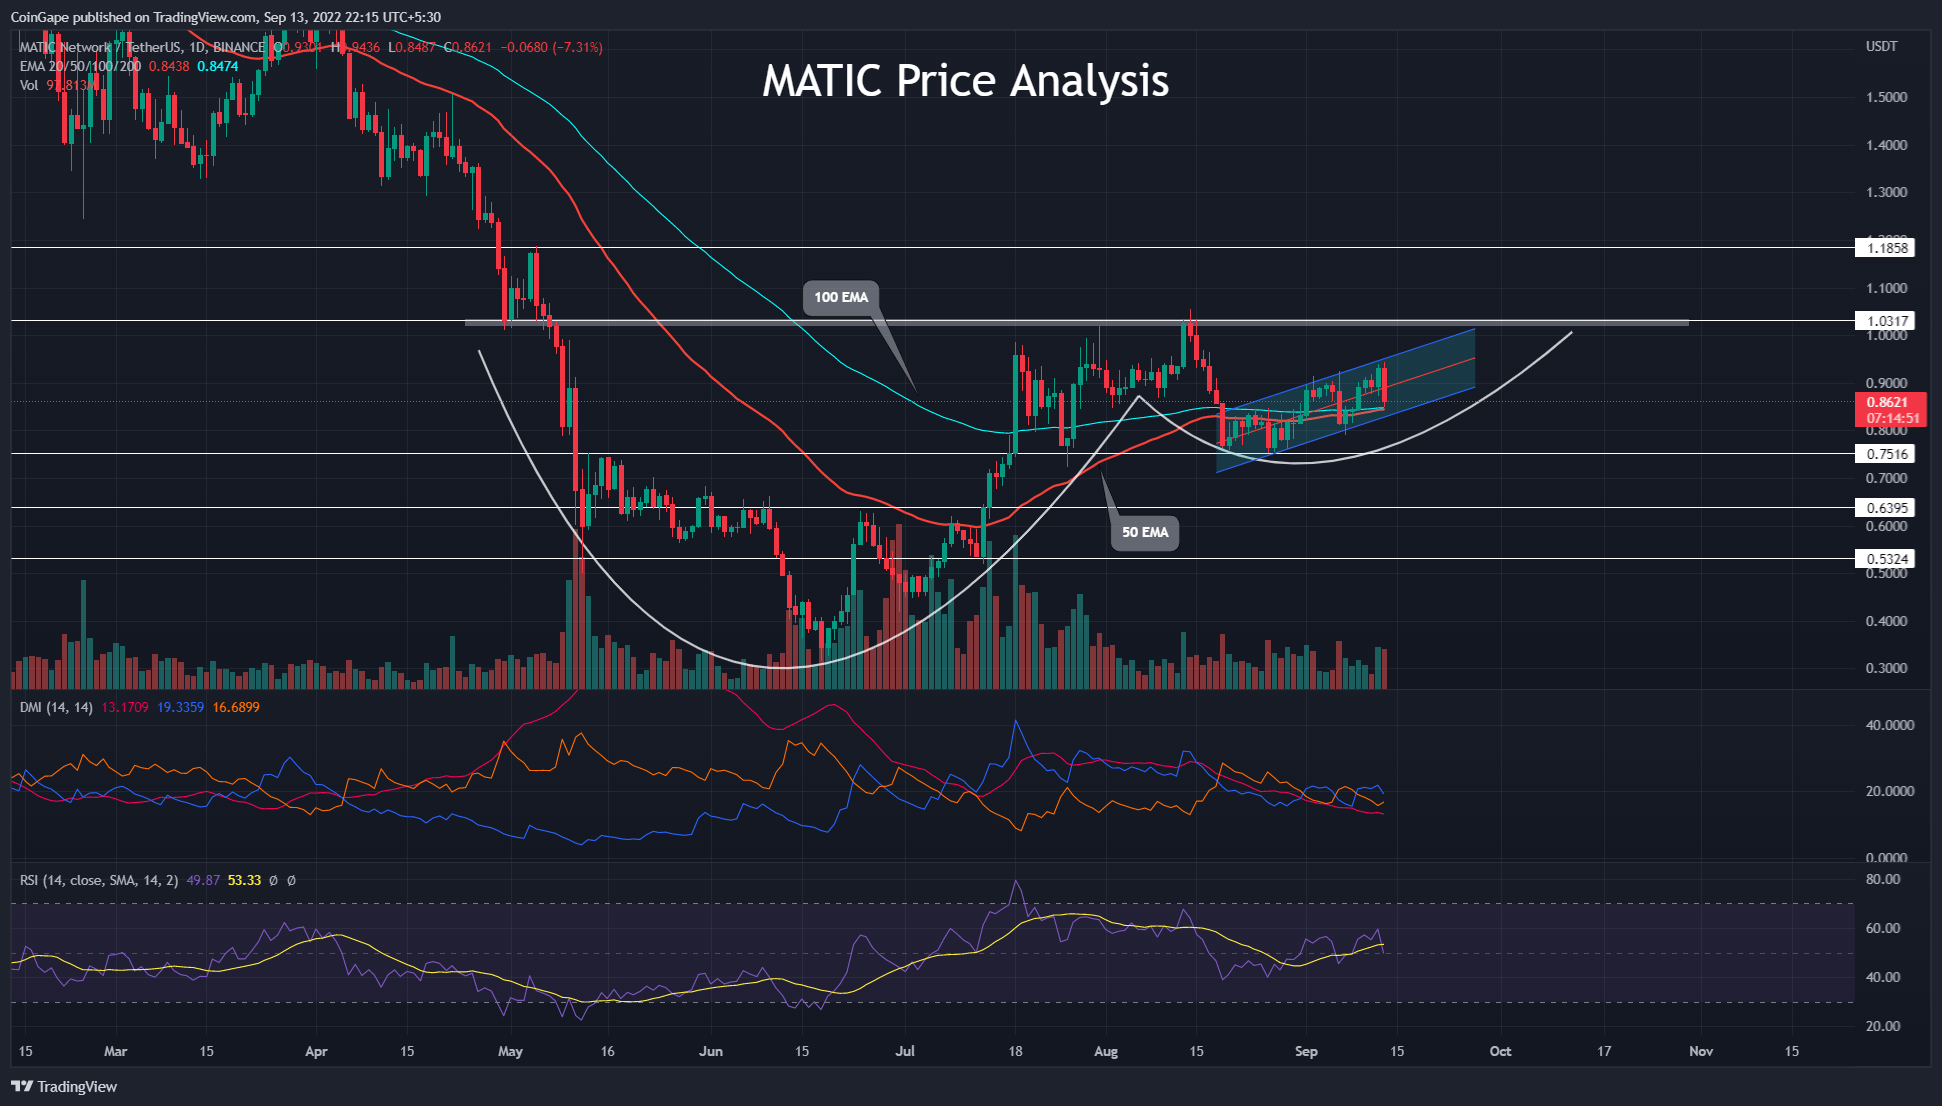
Despite being a bearish pattern, the rising parallel channel led the MATIC price to $1 resistance. Moreover, this resistance is the neckline of a cup and handle pattern holds significant weightage to determine the future market price. Thus, the coin holder should closely watch the price action near the $1 mark.
Key points from MATIC price analysis
- The support trendline carries the ongoing recovery in MATIC price
- The 50-and-100-day EMA on the verge of bullish crossover may attract more buyers to the market
- The intraday trading volume in the MATIC is $748.3 Million, indicating a 24.5% gain
In late August, the MATIC prices took a bullish reversal from the $0.75 support level, resulting in a rising channel pattern, accounting for a 25% jump. As a result, the bull cycle beats the 50-and-100-day EMA but struggles to reach the psychological mark of $1.0.
Taking the larger picture into account, the price action reveals a cup and handle pattern in the daily chart with a neckline at the psychological mark of $1.0. The ongoing bull cycle projects the possibility of pattern completion, which may shortly result in a bullish breakout if the buying pressure sustains.
However, amid today’s sell-off, the MATIC price tumbled 7.3% and shows a bearish engulfing candle in the rising channel.
Coming to the intraday trading volumes, the bearish engulfing candle finds seller commitment, teasing a rising channel fallout. If the prices manage to close below the support trendline, MATIC traders can find a short-term selling opportunity with a target of the $0.75 support level. Furthermore, if the increased selling pressure breaks the $0.75 level, a prolonged correction might test the psychological mark of $0.50.
However, an uptrend continuation reaching the psychological mark of $1.0 will increase the breakout possibility. And the unleashed bullish momentum upon successful breakout can test the overhead resistance of $1.30, accounting for a 30% jump.
Technical Indicators
DMI: due to the recent sell-off, the DI lines reverse sharply, indicating a bearish crossover possibility. And the falling adx line maintains the signal of weak Trend momentum.
Relative Strength Index: A steady growth in daily-RSI slope dips to the halfway line cracking under the 14-day SMA. Hence the Technical indicators maintain a slightly bearish viewpoint for MATIC.
- Resistance levels- $1 and $1.18
- Support levels-
- $0.815 and $0.75
Recent Posts
- Price Analysis
XRP Price Prediction: Will 4 Billion Transactions Spark Next Rally?
XRP price trades below the $2 mark after the latest correction across the broader cryptocurrency…
- Price Analysis
Solana Price Outlook: Will SOL Recover With Strong Institutional Buying?
Solana price remains steady above the $120 support after the recent crypto market pullback. The…
- Price Analysis
Ethereum Price Risks Crash to $2,500 Amid Sustained Wintermute Dumping
Ethereum price dropped below the key support at $3,000 on Tuesday, down by ~40% from…
- Price Analysis
Is It Time to Sell Bitcoin for Gold- Analyst Spots 2023 Pattern That Triggered BTC’s Last Major Rally
The Stock Market rose modestly as crypto market consolidation sparked a fresh Bitcoin vs Gold…
- Price Analysis
Bitcoin Price Prediction and Analysis: Will BTC Hit $100k Before Year-End?
Bitcoin price moves into the final trading sessions with uncertainty around upside continuation. BTC price…
- Price Analysis
Bitcoin Price Prediction As Michael Saylor Pauses BTC Purchase- Is A Fall to $74k Imminent?
Michael Saylor's Strategy has paused additional BTC purchases while increasing cash reserves, prompting renewed speculation…