Here’s Why XRP Price Could Extend Correction Trend; Back to $0.6?
For over a week, the XRP price resonated in a narrow sideways trend limited between two converging trendlines. This consolidation came after a massive rally on July 13th and was meant to stabilize the price trend and prolong the bullish trend. However, a breakdown from the pattern’s support trendline indicates, the 4th largest cryptocurrency would need longer correction.
Also Read: XRP Price Plummets 5% in 24 Hours – Is This The End of The Road for Bulls?
XRP Price Daily Chart:
- A support trendline breakdown set the XRP price for a 10% drop
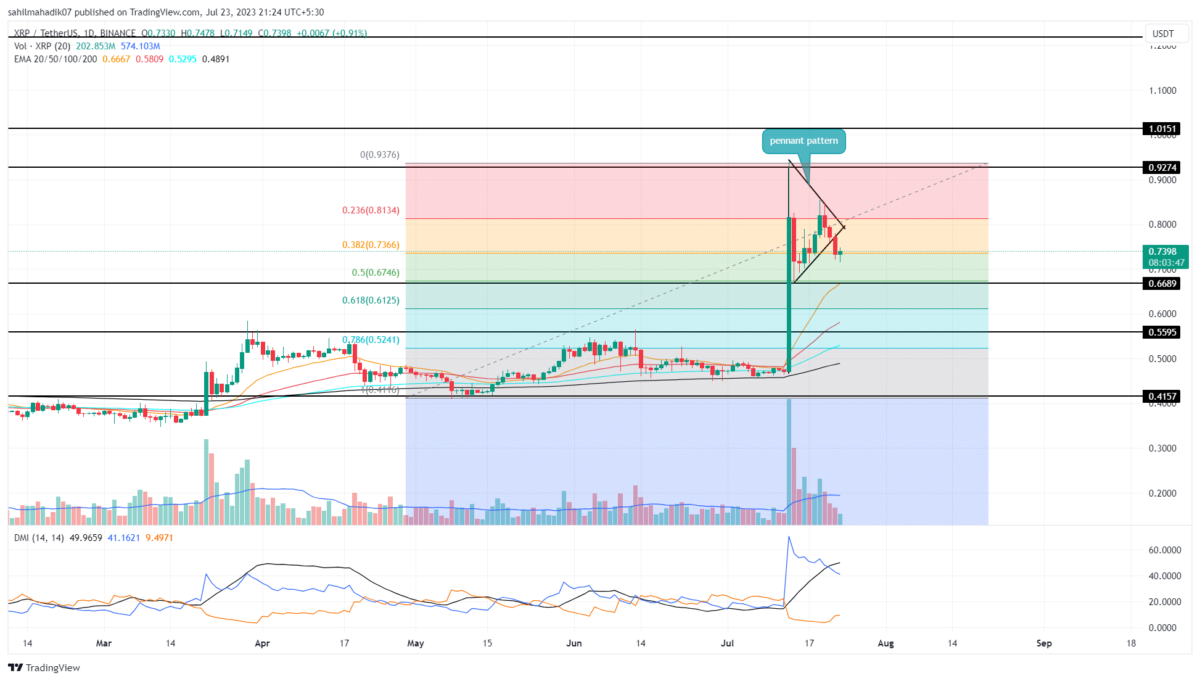
- The $0.669 support stands as a strong demand zone for the XRP price
- The intraday trading volume in the XRP is $1.87 Billion, indicating a 27% gain.
In the 4-hour time frame chart, the XRP price showcased the recent consolidation as the formation of a pennant pattern. However, on July 22nd, the coin price gave a bearish breakdown from the pattern’s support trendline.
A bearish outcome from a bullish pattern is a strong sell signal indicating a potential downfall in the near future. By the press time, the XRP price trades at $0.74 with a gain of 1.32%. This bullish uptick could retest the breached trendline to check price suitability for lower prices.
This post-breakdown fall could tumble this altcoin market value 9.5-10% down to hit $0.669.
Will XRP Price Plunge Back to $0.6?
The XRP price potential downfall to $0.669 would face strong support as aligned with the 50% Fibonacci retracement level. In technical analysis, a correction of 50% is still considered healthy and suitable to resume the prevailing bullish. However, a breakdown from this support plunged the price by 8.6% and tested the combined support of $0.6 and 61.8% FIB.
- Exponential Moving Average: The 20-day EMA at $0.669 increases the support strength of this level.
- Directional Movement Index: A significant gap between the positive crossover state of the DI+(blue) and DI-(orange) slope indicates the bullish momentum is intact.
Recent Posts
- Price Analysis
Bitcoin Price Prediction As Michael Saylor Pauses BTC Purchase- Is A Fall to $74k Imminent?
Michael Saylor's Strategy has paused additional BTC purchases while increasing cash reserves, prompting renewed speculation…
- Price Analysis
Aster launched Phase 5 Buyback Program Allocating 80% Fees. Will ASTER Price Rally?
Aster price hovered above $0.70 following a 2.67% daily gain, supported by a bullish market…
- Price Analysis
XRP Price Prediction: Rare Bullish Patterns Align With Powerful Catalysts
The XRP price has stabilized in the past few days as it jumped by ~9%…
- Price Analysis
Weekly Crypto Price Prediction: Bitcoin, Ethereum, and XRP as Market Momentum Builds
As Christmas week begins, the crypto market shows early signs of recovery. Over the past…
- Price Analysis
Will Solana Price Hit $150 as Mangocueticals Partners With Cube Group on $100M SOL Treasury?
Solana price remains a focal point as it responds to both institutional alignment and shifting…
- Price Analysis
SUI Price Forecast After Bitwise Filed for SUI ETF With U.S. SEC – Is $3 Next?
SUI price remains positioned at a critical intersection of regulatory positioning and technical structure. Recent…