How Far May XRP Price Extend Its Correction Phase?
In the latter part of July, the XRP price found suitable support at an ascending trendline near $0.67. However, with increased bearishness in the crypto market, the sellers gained an advantage and breached the aforementioned support with high volume. This breakdown intensified the selling momentum leading to the bloodbath of six red candles. Will XRP sellers evaporate the July 13% gain?
Also Read: XRP Lawsuit Has Delayed Ripple’s Product Development: Flare Founder
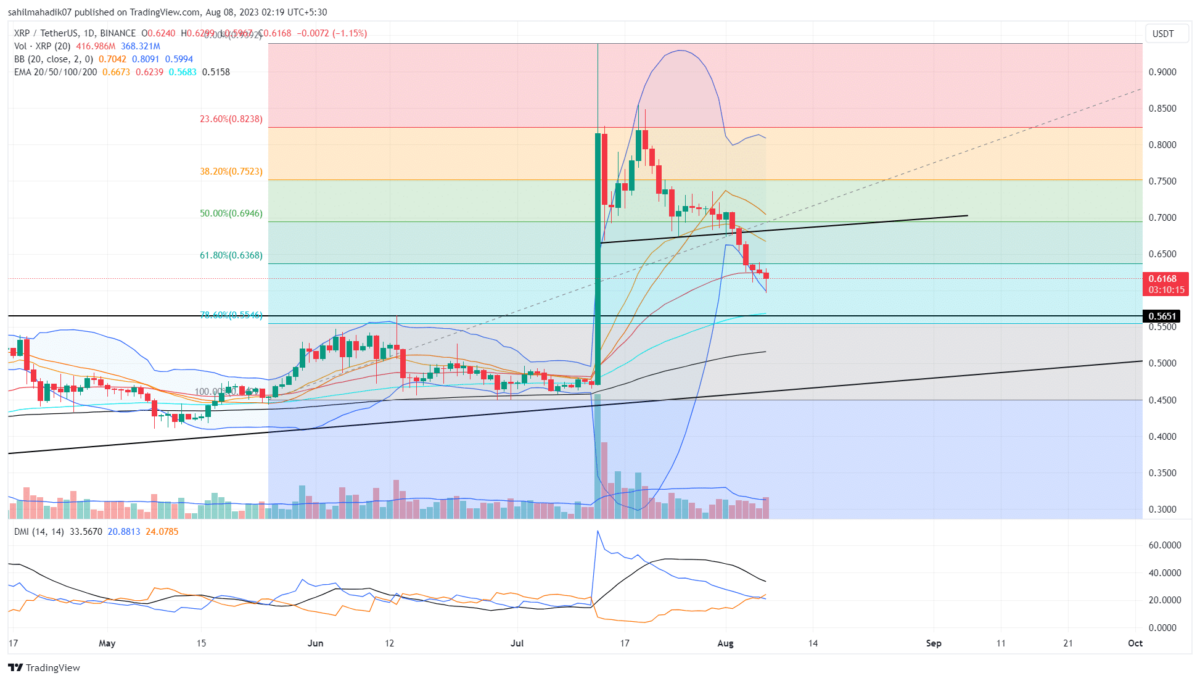
XRP Price Daily Chart:
- The XRP price falling with increasing volume indicates sustained selling from market participants.
- The $0.56 level stands as a strong support zone for buyers.
- The intraday trading volume in the XRP is $1.4 Billion, indicating a 75.1% gain.
On August 3rd, the XRP price gave a high momentum breakdown from the support trendline, which held buyers during the second half of July. From the breakdown point($0.679), the altcoin tumbled nearly 10% to reach the current price of $0.614.
Amid this downfall, the sellers also breached the 61.8% Fibonacci retracement level. In technical analysis, a breakdown below the 50% level starts, indicating weakness in the prevailing trend. Therefore, traders must remain cautious of the current downfall as a drop of such length indicates weakness in bullish momentum.
With sustained selling, the XRP price could drop another 8% to reach the next significant support of $0.56 aligned with 78.6% FIB. Losing this support would offset the recovery witnessed on July 13th.
Will XRP Price Rise Back to $0.66?
The daily chart projecting a long-tail rejection indicates that buyers are entering the market at a discounted price. This buildup of bullish momentum may trigger a pullback in a downward trend. If the anticipated uptick showed sustainability below the breached trendline or $0.66, the sellers are likely to extend the correction trend.
- Bollinger Band: The downsloping lower band of the Bollinger band indicator indicates high momentum selling among traders.
- Directional Moving Index: A bearish crossover between the DI+(blue) and DI(orange) slope reflects the selling signal in the market.
Recent Posts
- Price Analysis
Will Solana Price Hit $150 as Mangocueticals Partners With Cube Group on $100M SOL Treasury?
Solana price remains a focal point as it responds to both institutional alignment and shifting…
- Price Analysis
SUI Price Forecast After Bitwise Filed for SUI ETF With U.S. SEC – Is $3 Next?
SUI price remains positioned at a critical intersection of regulatory positioning and technical structure. Recent…
- Price Analysis
Bitcoin Price Alarming Pattern Points to a Dip to $80k as $2.7b Options Expires Today
Bitcoin price rebounded by 3% today, Dec. 19, reaching a high of $87,960. This rise…
- Price Analysis
Dogecoin Price Prediction Points to $0.20 Rebound as Coinbase Launches Regulated DOGE Futures
Dogecoin price has gone back to the spotlight as it responds to the growing derivatives…
- Price Analysis
Pi Coin Price Prediction as Expert Warns Bitcoin May Hit $70k After BoJ Rate Hike
Pi Coin price rose by 1.05% today, Dec. 18, mirroring the performance of Bitcoin and…
- Price Analysis
Cardano Price Outlook: Will the NIGHT Token Demand Surge Trigger a Rebound?
Cardano price has entered a decisive phase as NIGHT token liquidity rotation intersects with structural…