How Long Will Chainlink Price Consolidation Last?


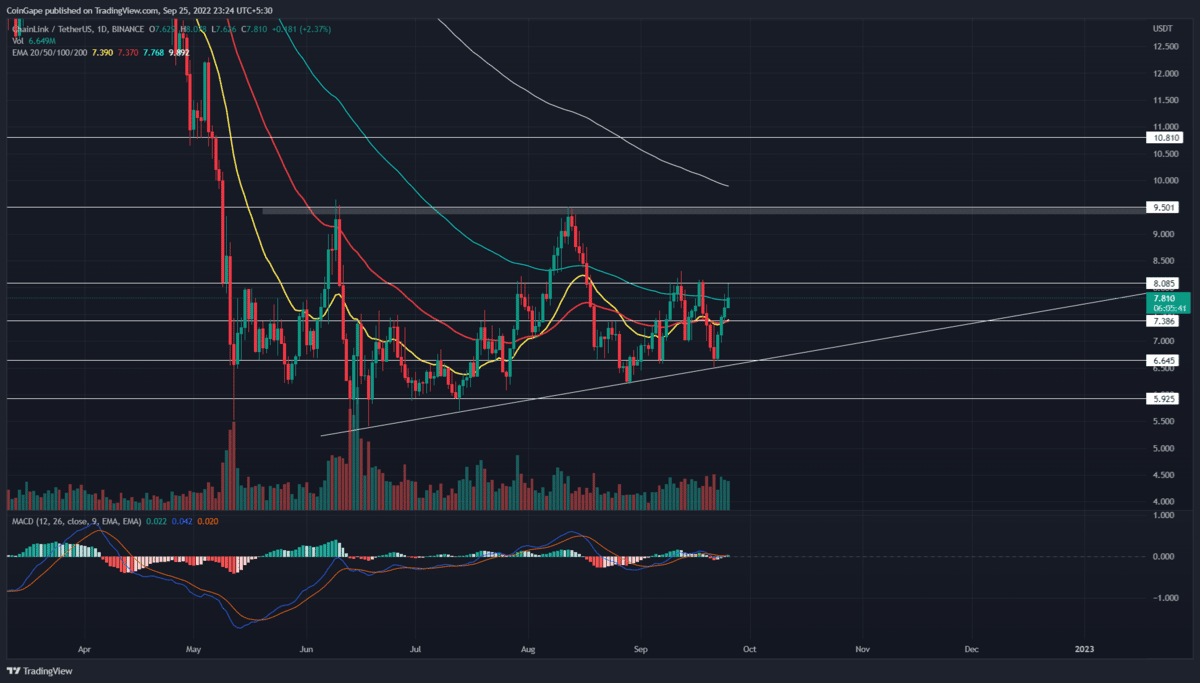
The chainlink price chart shows the formation of an ascending triangle pattern. Under the influence of this pattern, the coin’s market value should increase significantly. Thus, the neckline resistance of $9.5 and rising support trendline are the important levels that may influence the coins’ future price.
Key points from Chainlink price:
- The ascending triangle pattern governs the chainlink price action
- The daily-RSI slope renters the bullish region
- The intraday trading volume in the LINK coin is $706.5 Billion, indicating a 22.6% gain.
 Source- Tradingview
Amid the recent correction in the crypto market, the Chainlink price has struggled to surpass a local resistance of $8. As a result, the coin price witnessed an aggressive downfall last week and retested the ascending support trendline.
This coin price has rebounded from this support multiple times, indicating the buyers are actively buying at this support. On September 22nd, the Chainlink price rebounded from this support trendline with a morning star candle. Thus, the replenished bullish momentum rose for four consecutive days, registering a 21.3% gain.
The V-shaped recovery undermined the prior correction and hit the $8 resistance. However, this bullish rally backed by decreasing volume indicates weak bullish commitment. Thus, with this volume action, the altcoin price is likely to revert from this resistance.
Thus, a potential reversal could continue the ongoing consolidation and plunge the prices back to support the trendline this coming week. The coin holder can maintain a bullish outlook until this ascending trendline is intact.
Furthermore, in response to the bullish pattern, the Chainlink price should eventually breach the $8 resistance and rise 17.5% higher to the $9.5 neckline resistance.
Under a strong bullish scenario, a bullish breakout from the neckline resistance will trigger the triangle pattern to encourage further bull-run.
Technical Indicator
EMAs: the flattish EMAs(20, 50, and 100) accented a sideways rally in chainlink price. However, the 20-and-50-day EMA wavering at the $7.3 level forms strong confluence support.
MACD indicator: the fast and slow lines wavering around the midline indicate uncertainty among market participants.
- Resistance levels- $8 and $9.5
- Support levels- $7.38 and $6.65

Why Trust CoinGape
CoinGape has covered the cryptocurrency industry since 2017, aiming to provide informative insights Read more…to our readers. Our journal analysts bring years of experience in market analysis and blockchain technology to ensure factual accuracy and balanced reporting. By following our Editorial Policy, our writers verify every source, fact-check each story, rely on reputable sources, and attribute quotes and media correctly. We also follow a rigorous Review Methodology when evaluating exchanges and tools. From emerging blockchain projects and coin launches to industry events and technical developments, we cover all facets of the digital asset space with unwavering commitment to timely, relevant information.

Related Articles


- Bitcoin Shows Greater Weakness Than Post-LUNA Crash; Is a Crash Below $60K Next?
- XRP Tops BTC, ETH in Institutional Flows As Standard Chartered Lowers 2026 Forecasts
- Bitcoin vs. Gold: Expert Predicts BTC’s Underperformance as Options Traders Price in $20K Gold Target
- CLARITY Act: White House to Hold Another Meeting as Crypto and Banks Stall on Stablecoin Yield Deal
- Bitcoin as ‘Neutral Global Collateral’? Expert Reveals How BTC Price Could Reach $50M
- Dogecoin, Shiba Inu, Pepe Coin Price Predictions As BTC Crashes Below $68k
- Ethereum Price Outlook as Harvard Shifts Focus from Bitcoin to ETH ETF
- HOOD and COIN Stock Price Forecast as Expert Predicts Bitcoin Price Crash to $10k
- XRP Price Prediction Ahead of Supreme Court Trump Tariff Ruling
- Crypto Price Prediction For This Week: Dogecoin, Solana and Cardano
- Bitcoin Price Prediction: How Could Brazil’s Strategic Bitcoin Reserve Proposal Impact BTC?


