How Long Will Chainlink Price Consolidation Last?
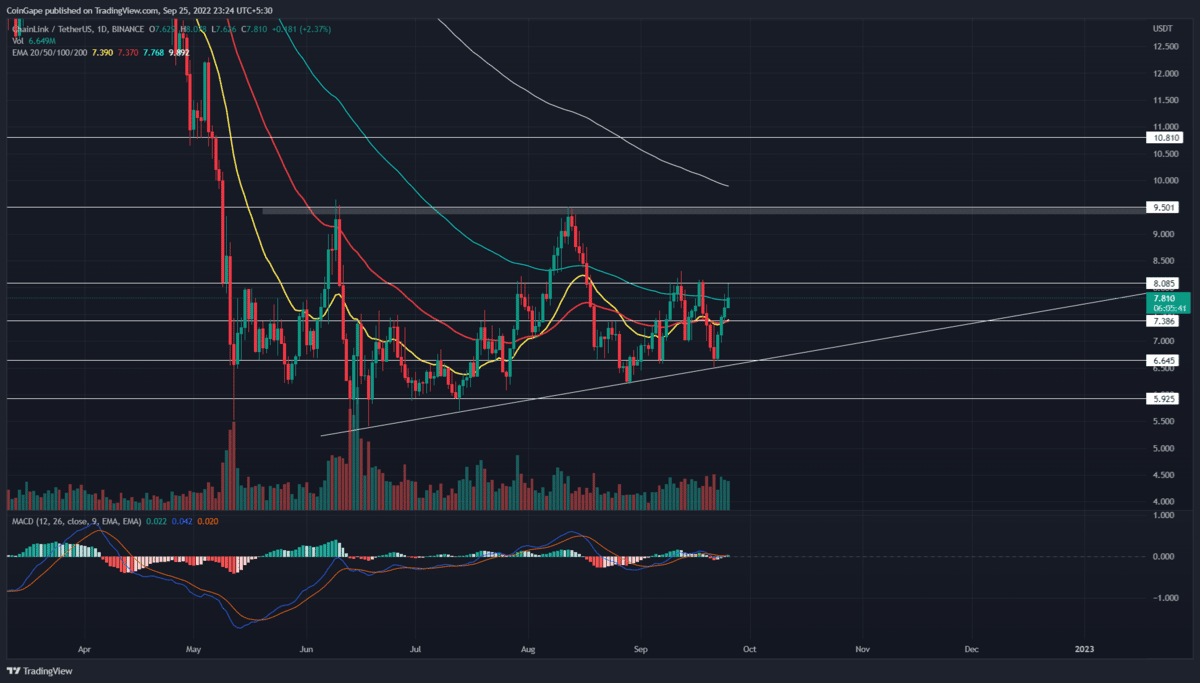
The chainlink price chart shows the formation of an ascending triangle pattern. Under the influence of this pattern, the coin’s market value should increase significantly. Thus, the neckline resistance of $9.5 and rising support trendline are the important levels that may influence the coins’ future price.
Key points from Chainlink price:
- The ascending triangle pattern governs the chainlink price action
- The daily-RSI slope renters the bullish region
- The intraday trading volume in the LINK coin is $706.5 Billion, indicating a 22.6% gain.
Amid the recent correction in the crypto market, the Chainlink price has struggled to surpass a local resistance of $8. As a result, the coin price witnessed an aggressive downfall last week and retested the ascending support trendline.
This coin price has rebounded from this support multiple times, indicating the buyers are actively buying at this support. On September 22nd, the Chainlink price rebounded from this support trendline with a morning star candle. Thus, the replenished bullish momentum rose for four consecutive days, registering a 21.3% gain.
The V-shaped recovery undermined the prior correction and hit the $8 resistance. However, this bullish rally backed by decreasing volume indicates weak bullish commitment. Thus, with this volume action, the altcoin price is likely to revert from this resistance.
Thus, a potential reversal could continue the ongoing consolidation and plunge the prices back to support the trendline this coming week. The coin holder can maintain a bullish outlook until this ascending trendline is intact.
Furthermore, in response to the bullish pattern, the Chainlink price should eventually breach the $8 resistance and rise 17.5% higher to the $9.5 neckline resistance.
Under a strong bullish scenario, a bullish breakout from the neckline resistance will trigger the triangle pattern to encourage further bull-run.
Technical Indicator
EMAs: the flattish EMAs(20, 50, and 100) accented a sideways rally in chainlink price. However, the 20-and-50-day EMA wavering at the $7.3 level forms strong confluence support.
MACD indicator: the fast and slow lines wavering around the midline indicate uncertainty among market participants.
- Resistance levels- $8 and $9.5
- Support levels- $7.38 and $6.65
Recent Posts
- Price Analysis
Here’s Why Solana Price Will Hit $200 This Month
Solana price held firm above $130 after recovering from the $120 level, rising 4% in…
- Price Analysis
Bitcoin Price Rally Could Hit $107K, Legendary Trader Predicts Ahead of US Jobs Data
Bitcoin price rally stalled at a crucial resistance level as the recent bull run lost…
- Price Analysis
Top 3 Crypto Prices Prediction: Dogecoin, Cardano, and Chainlink Poised for Big Moves
The crypto market gained 1.99% over the last 24 hours, extending a 7-day rise of…
- Price Analysis
Ethereum Price Eyes $4K as BitMine Stakes $2.5B in ETH
BitMine staked $2.5 billion worth of Ether, underscoring rising institutional appetite. Ethereum held above $3,200,…
- Price Analysis
Bitcoin and Gold Price Prediction as Venezuela Conflict Fuels Investor Uncertainty
The Venezuela crisis intensified, pushing investors toward safe-haven assets like Bitcoin and Gold. Prices for…
- Price Analysis
Expert Predicts a 246% Shiba Inu Price Surge as a Rare Pattern Forms
Shiba Inu price continued its strong bull run on Monday, reaching its highest point since…