Is Binance Coin Price at Risk of a Breakdown After this Bearish Pattern Formation?


Highlights
- The head-and-shoulders structure adds stronger downside pressure on the Binance coin price.
- DMI and RSI readings strengthen the bearish outlook by confirming seller control across the trend.
- Spot Taker CVD data shows persistent sell-side dominance restricting upside attempts near key zones.
The Binance coin price trades under strong pressure today as fear overwhelms the broader crypto market. Sentiment remains stuck in Extreme Fear, and the Fear Index has extended its stay to a rare fifth day, as Bitcoin drops below 90k.
This signals deeper hesitation among participants and brings heavier stress to the BNB coin price, which now reacts to every small shift in market psychology. Many large assets struggle to find stable footing, and BNB stands inside that same cycle of uncertainty.
Meanwhile, dips trigger sharper selling, and bounce attempts weaken before building any structure. This wider environment forces BNB coin price into a tougher position as technical patterns also point toward a defensive phase.
Binance Coin Price Faces Tightening Technical Pressure
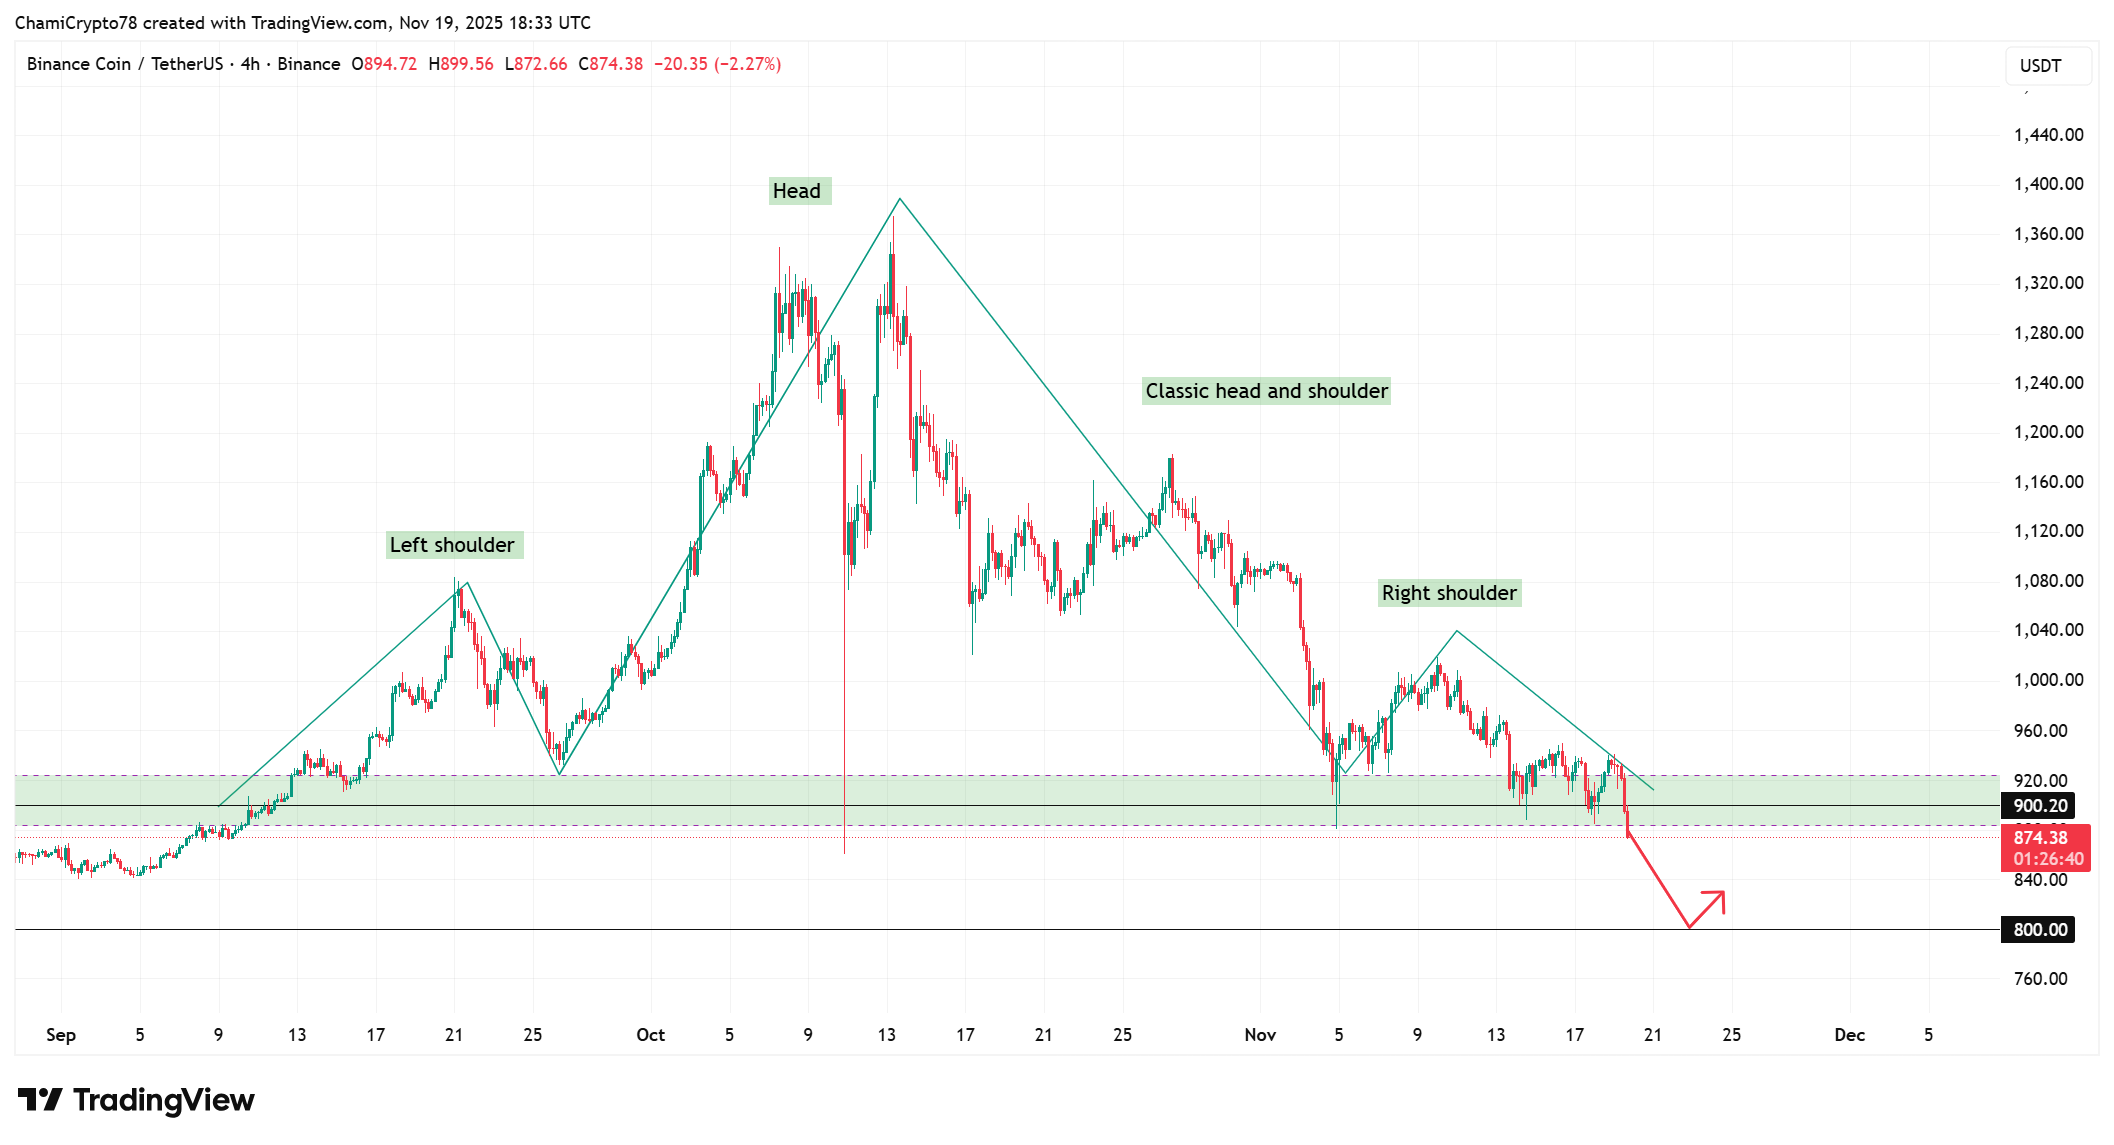
The chart shows a clear head-and-shoulders structure, and that pattern guides most movements on the current setup. BNB formed the left shoulder late in September, then created the head in mid-October after a strong rally.
However, the right shoulder developed in early November with weaker highs and softer reactions. That shift confirms stronger pressure from sellers as the pattern tightens across the neckline.
At the time of press, BNB has dropped to $875, and that decline adds more weight on the $900 zone. This level still responds to intraday tests, yet each attempt weakens its reliability. Price now trades firmly below that barrier, which opens room toward $800 if sellers maintain pressure.
Meanwhile, buyers try to spark small rebounds, but those attempts fall short because the broader structure supports downside continuation. This chart now favors a deeper test before any stable recovery forms, mirroring the broader crypto market crash.
DMI And RSI Signal Strong Seller Control
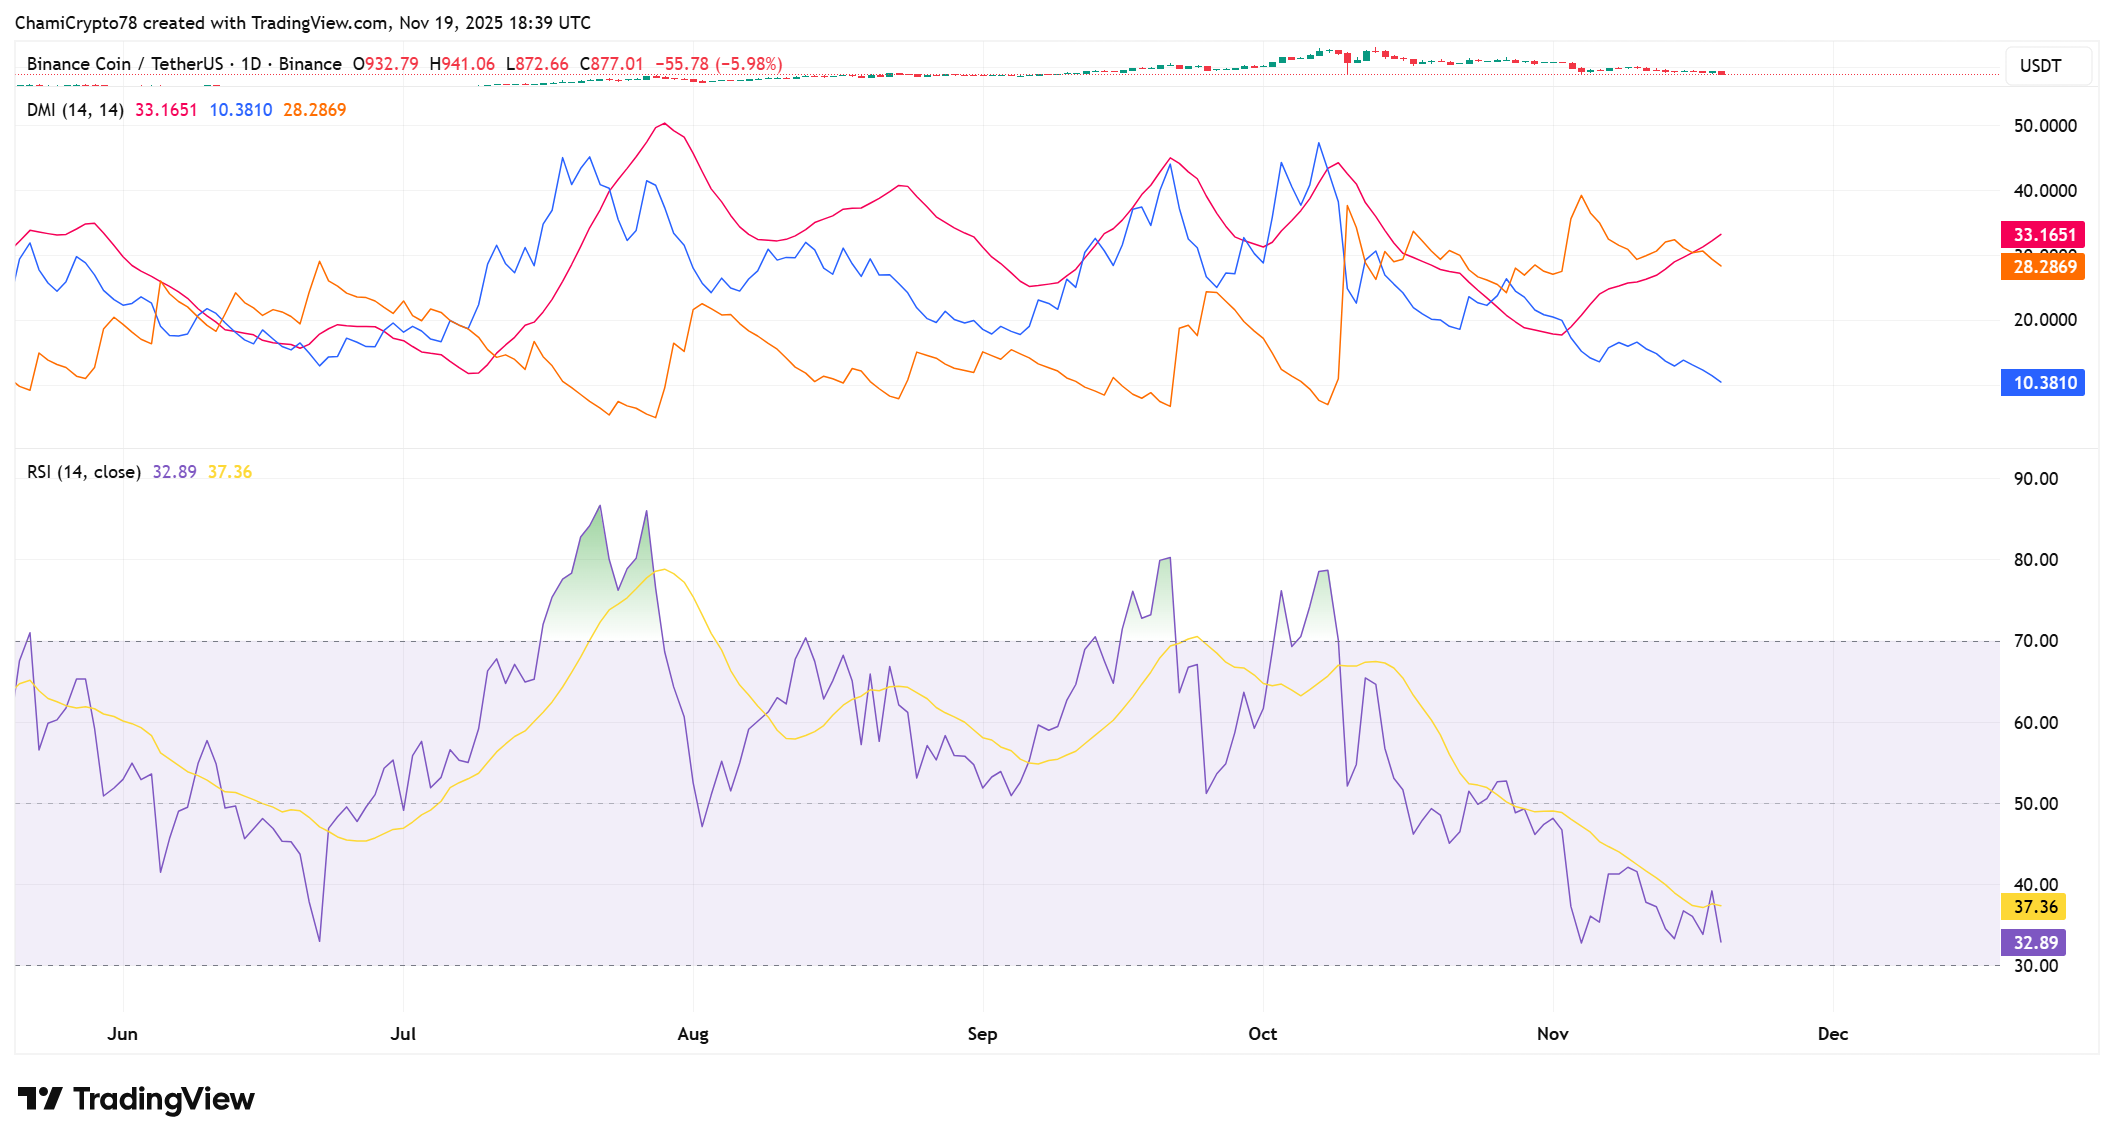
The DMI lines confirm clear direction as the negative line holds far above the positive line. The +D sits at 10, while the -D stays near 28. That gap highlights firm selling strength. The ADX prints around 33, and that reading signals a solid trend guided by sellers.
The RSI trades near 33 and continues drifting lower with steady pace. It also stays under the signal line with no strong attempts to cross back over it. That setup supports further weakness and weighs on the long-term BNB price performance. The indicator now reflects the same behavior seen across the chart, and both tools point toward more downside before any stable shift develops.
Heavy Sell Taker Activity Drives Market Control
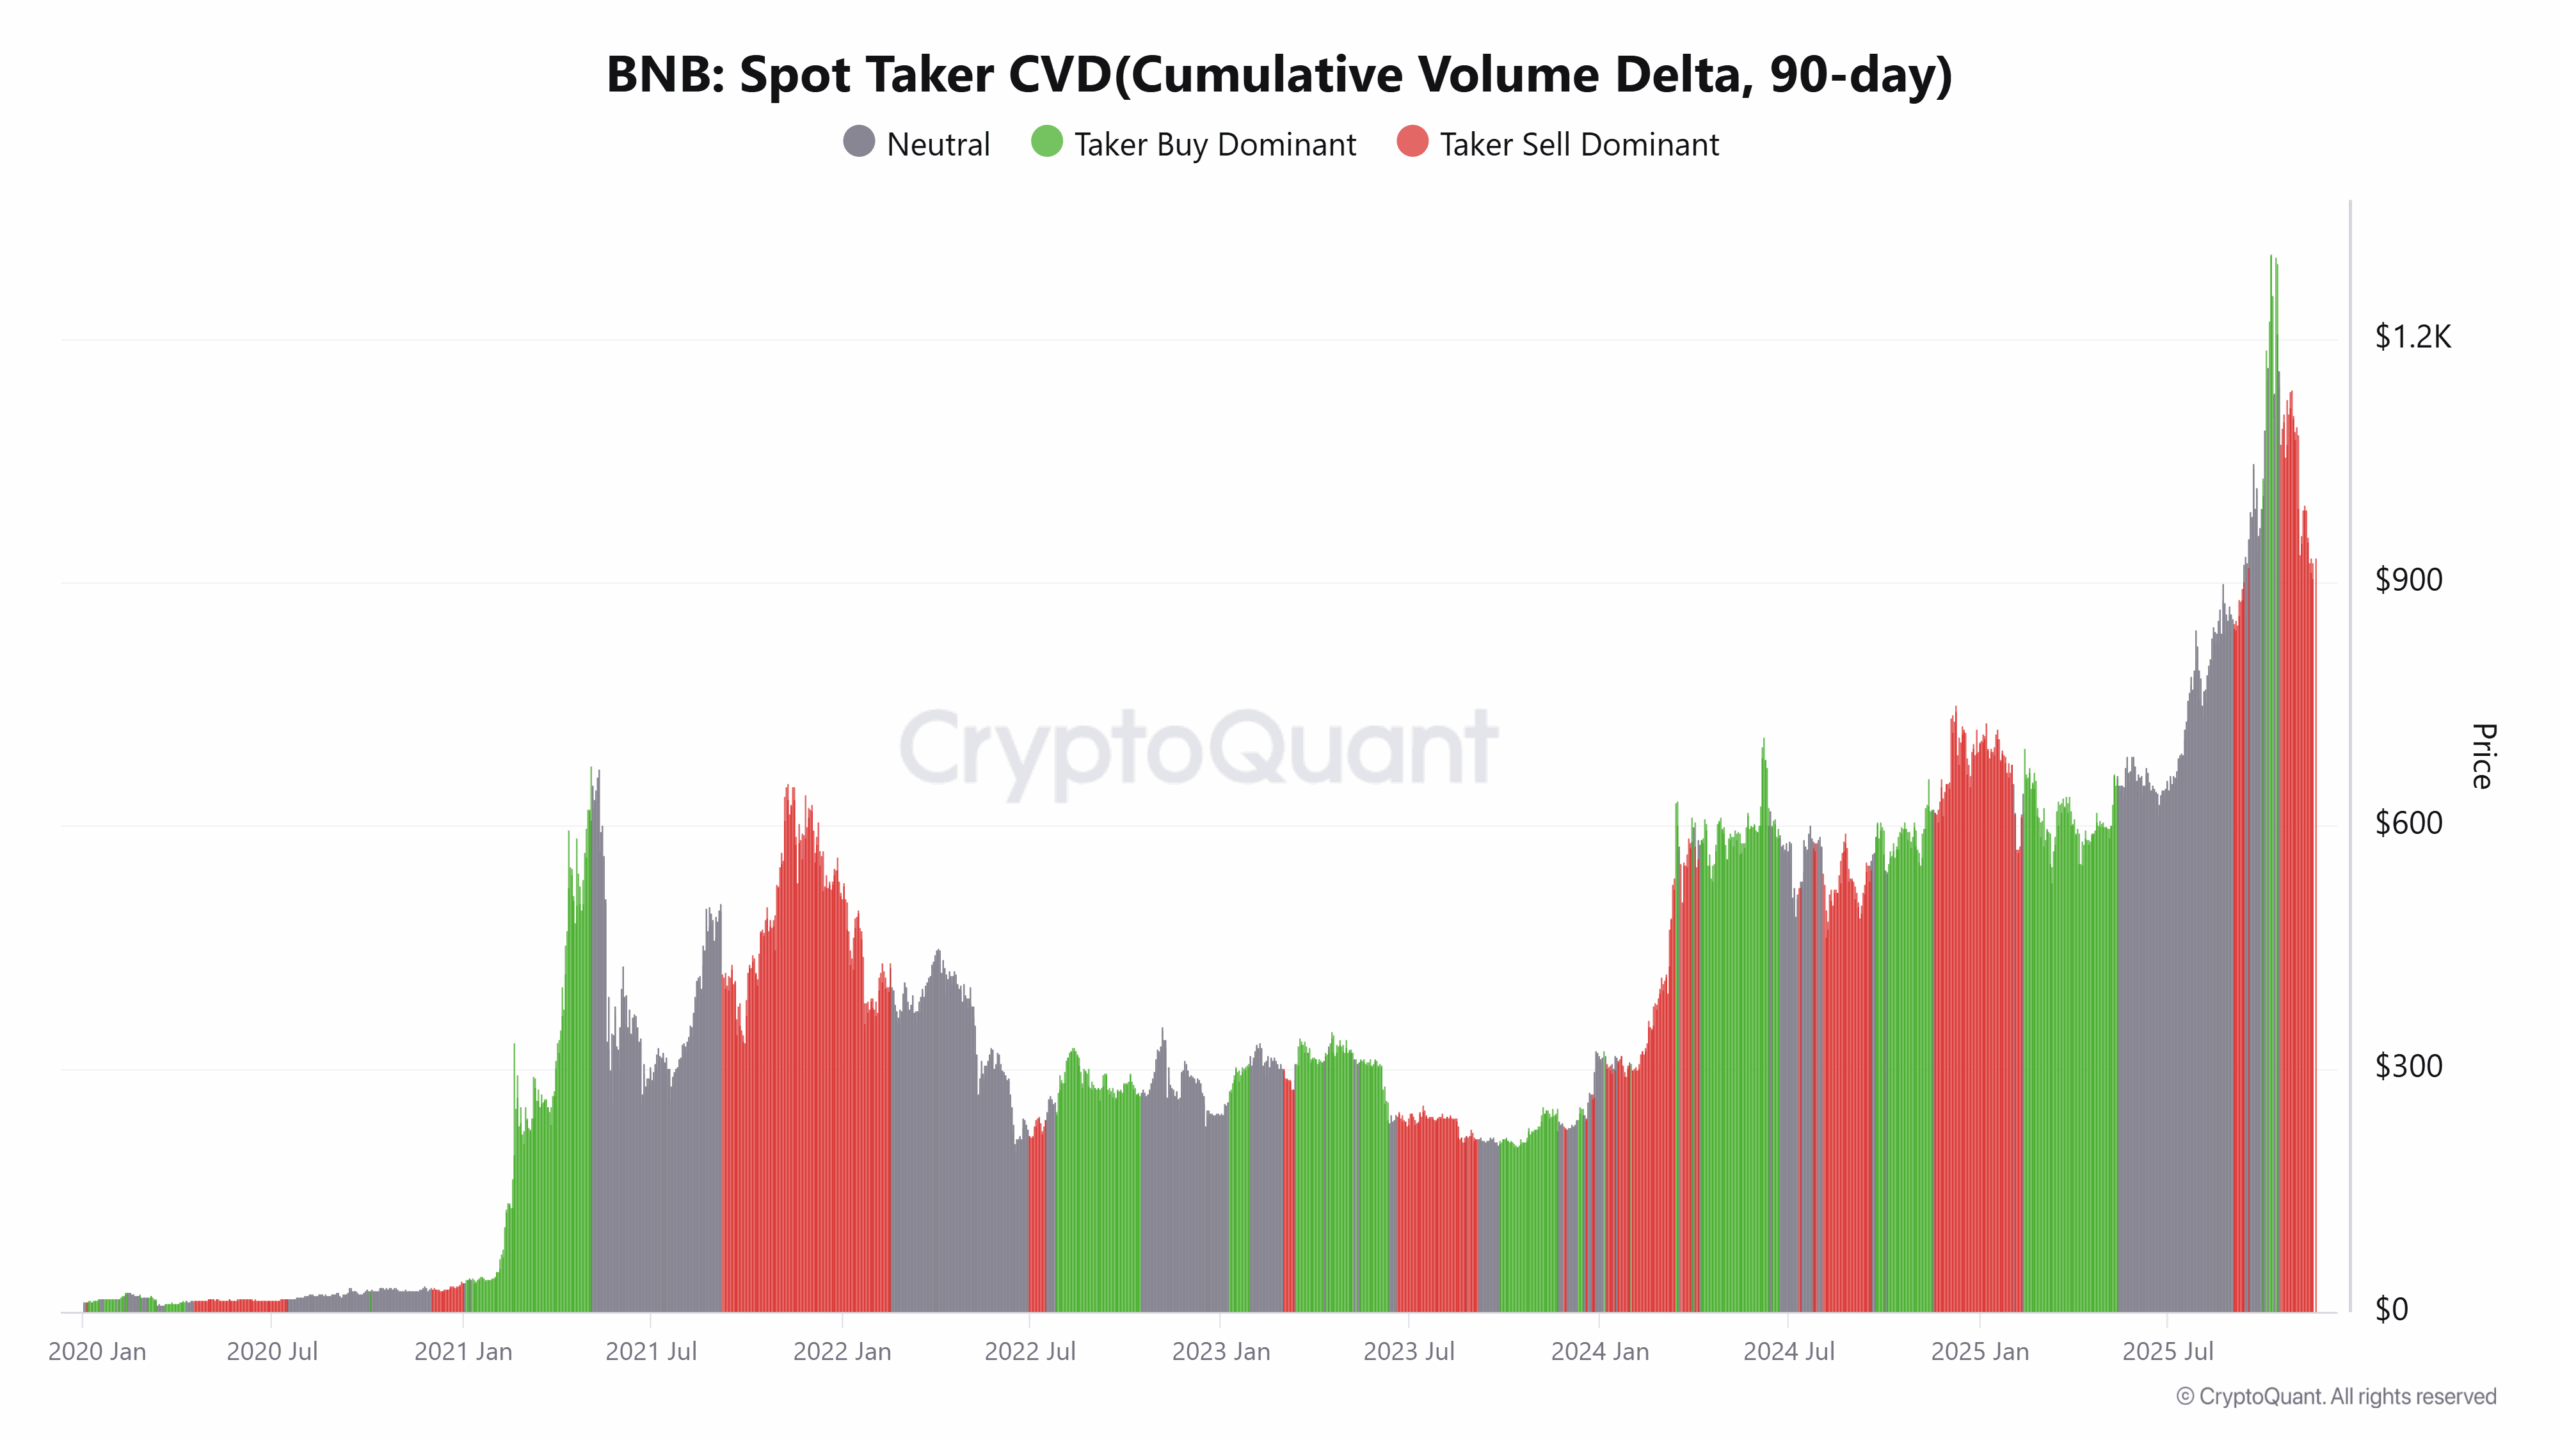
The Spot Taker CVD chart shows strong sell dominance as market sell orders continue to outweigh market buy orders. This imbalance keeps pushing the BNB coin price lower and limits the strength of every bounce. The slope of the CVD curve tilts downward, which shows steady cumulative selling across multiple weeks.
This pressure aligns closely with the chart’s reversal pattern and confirms weakness at every major level. Buy-side takers show little depth, and that creates fast rejections when price tries to climb.
Meanwhile, sellers keep control by stepping in at small rallies, which leaves the Binance coin price exposed to deeper tests. A slide toward $800 remains the likely path unless buy-side takers return with stronger conviction.
Conclusively, BNB now trades inside a heavy technical phase defined by strong seller control. The head-and-shoulders structure points toward deeper tests, and indicators align with that direction.
Taker activity also strengthens the case for continued downside as sell orders dominate buy attempts. A move toward $800 remains the most realistic scenario before any meaningful recovery finds support, and BNB needs stronger buy activity to change this path.
Frequently Asked Questions (FAQs)
1. What does the Extreme Fear reading indicate about market behavior?
2. How does the DMI help interpret market direction?
3. Why is Spot Taker CVD useful for understanding short-term pressure?

Why Trust CoinGape
CoinGape has covered the cryptocurrency industry since 2017, aiming to provide informative insights Read more…to our readers. Our journal analysts bring years of experience in market analysis and blockchain technology to ensure factual accuracy and balanced reporting. By following our Editorial Policy, our writers verify every source, fact-check each story, rely on reputable sources, and attribute quotes and media correctly. We also follow a rigorous Review Methodology when evaluating exchanges and tools. From emerging blockchain projects and coin launches to industry events and technical developments, we cover all facets of the digital asset space with unwavering commitment to timely, relevant information.