Is Bitcoin Market Value Dropping Below $18800?
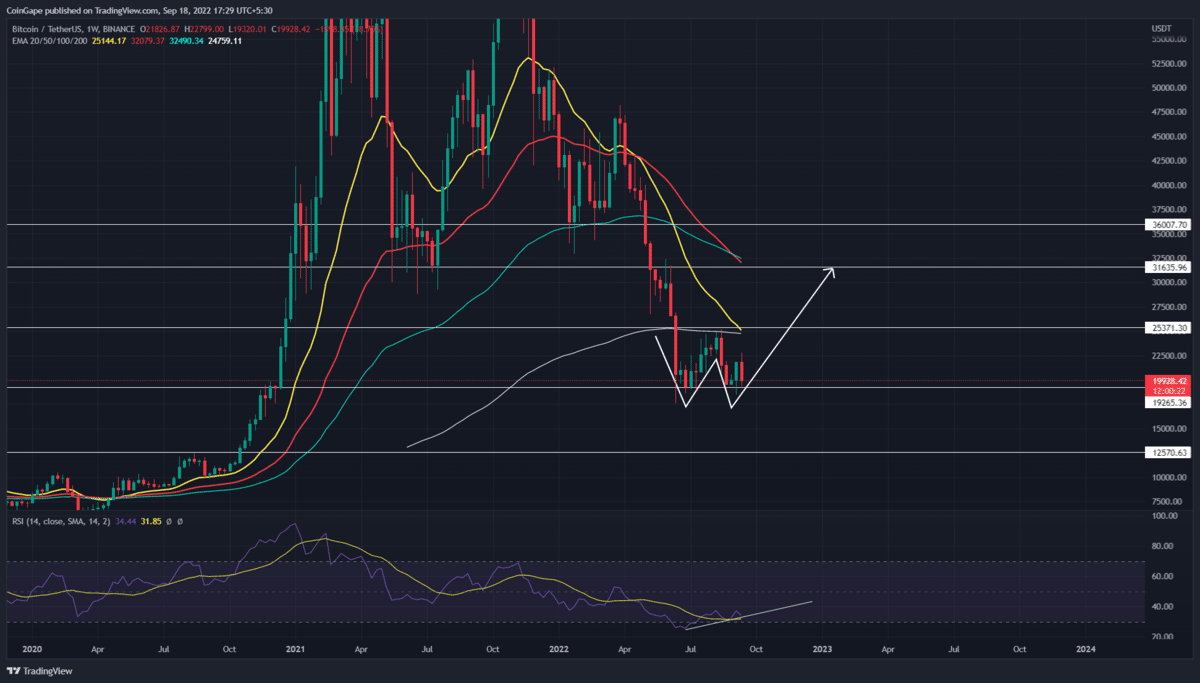
The Bitcoin weekly chart shows the price is well supported at the $19000-$18800 demand zone. Last week the coin price rebounded from this support with a morning star candle pattern showing a possibility of forming a double bottom pattern.
Key points
- The Bitcoin price could retest the $20500 level as potential resistance before falling to $18800
- The weekly chart shows an evident bullish divergence in the RSI chart
- The intraday trading volume in Bitcoin is $24.9 Billion, indicating a 14.5% loss
The aforementioned reversal pattern can replenish the bullish momentum and trigger a new recovery rally. A bullish breakout from the $25000 neckline could provide a bull run to the $31700.
However, the recent CPI data released impacted the Bitcoin market value negatively. Thus, prices will likely retest the buyer’s commitment at the $19000-$18800 support.
Anyhow, if the Bitcoin price sustains above this support, the bullish pattern will remain intact, and so does the recovery theory.
Willy Woo Hints Bitcoin Market Value has not Bottomed Yet
In this chart, the Blue line represents the percentage of losses the coin witnessed. Thus, Analyst Willy woo said, “In terms of max pain, the market has not felt the same pain as prior bottoms.”
The tweet accentuated that currently, only 52% of coins are underwater. However, the prior bottoms were 61%, 64%, and 57%.
Thus, if the selling pressure persists and breaches the $18800 support, the next crucial support zone would be at $12250.
Technical indicator
EMAs: the weekly EMAs bolster the resumption of the prior downtrend with the bearish crossover of 50 and 100 EMAs and the potential crossover of 20 and 200 EMAS.
Relative strength index: A bullish divergence in daily-RSI indicates strength in bullish momentum. Thus, the rising indicator slope hints at a price reversal or extended consolidation above the $19000-$18000 support.
- Resistance level- $22550 and $25000
- Support level- $19600 and $19000-$18000
Recent Posts
- Price Analysis
FUNToken Price Surges After MEXC Lists $FUN/USDC Pair
FUNToken, one of the most talked-about low-cap cryptos on the market with P2E undertones, has…
- Price Analysis
Bitcoin Price on Edge as $24B Options Expire on Boxing Day — Is $80K About to Crack?
Bitcoin enters the final stretch of the year with the price behavior signaling a decisive…
- Price Analysis
Crypto Market Rebounds: Are Bulls Positioning for a Santa Rally?
Crypto markets saw a 0.94% rise in the last 24 hours, contributing to a…
- Price Analysis
XRP, Bitcoin, Ethereum Price Predictions Ahead of Jan 2026 CLARITY Act and US Crypto Reserve Plans
The XRP, Bitcoin, and Ethereum prices remained in a bear market after falling by over…
- Price Analysis
Pi Network Analysis: Pi Coin Price Surges on Christmas Eve, Can It Hit Year-End Highs?
Pi coin price reflect cautious positioning as market structure tightens near a key base. The…
- Price Analysis
Why Dec 26th Is A Do Or Die for Bitcoin Price Ahead Of Record Options Expiry?
As Christmas winds down, the Bitcoin price dipped 0.74% to around $86,750. Market participants…