Is Bitcoin Price Drop to $29000 a Warning Sign or Buying Opportunity?
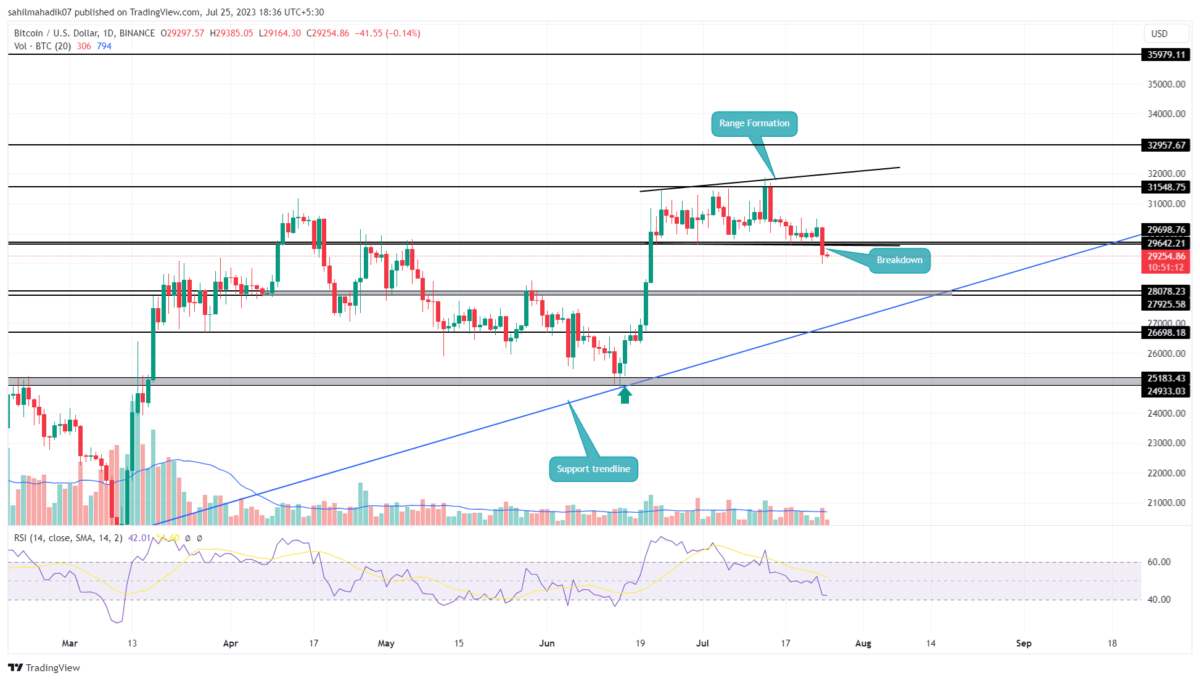
The Bitcoin price traded sideways over a month and created an uncertain sentiment in the crypto market. This range was limited between the two diverging trendlines showcasing the formation of a megaphone pattern. However, with a recent downtick in the market sentiment, the BTC price gave a bearish breakdown from the supported trendlines of the aforementioned range reflecting a potential downfall in the near future. However, is this breakdown enough to go bearish on Bitcoin?
Also Read: Crypto Slowly Losing Edge Over US Equities Amid Bitcoin Price Retreat
Bitcoin Price Daily Chart
- A bearish breakdown from the $28640 support sets the BTC price for a 5% drop
- A long-coming support trendline maintains the overall bullish trend.
- The intraday trading volume in Bitcoin is $11.7 Billion, indicating a 14.7% loss.
On July 24th, the Bitcoin price gave a high momentum breakdown from the bottom trendline at $28640 support. The long consolidation ending in the seller’s favor reflects an upcoming downfall in BTC price.
As of now, the largest cryptocurrency Bitcoin traded at 29230 with an entire loss of 0.22%. Interested traders can look to sell the opportunity at this point or wait for a pullback to $29230. This retest would validate price sustainability at lower prices and offer a better entry opportunity.
If the coin price sustains this breakdown, the sellers could drive a downfall of 4 to 5% and test the $28000 psychological support.
[converter id=”btc-bitcoin” url=”https://coingape.com/price/converter/btc-to-usd/”]
Time to Sell Bitcoin?
Considering the bigger picture, the anticipated correction would still be a part of a longer uptrend. Therefore a retest to the $28000 support would also meet the ascending support trendline carrying a recovery phase in Bitcoin price for the past seven months. Until the support trendline is intact, the coin holders can maintain the bullish outlook and also look for an opportunity to reaccumulate.
- Bollinger Band: the Bitcoin price challenging the lower band of the Bollinger band indicator indicates high momentum in selling activity
- Relative Strength Index: A bearish divergence in the daily RSI slope started reflecting weakness in bullish. however, a breakdown below the 40% mark will also offer an additional edge to market sellers.
Recent Posts
- Price Analysis
Will Solana Price Hit $150 as Mangocueticals Partners With Cube Group on $100M SOL Treasury?
Solana price remains a focal point as it responds to both institutional alignment and shifting…
- Price Analysis
SUI Price Forecast After Bitwise Filed for SUI ETF With U.S. SEC – Is $3 Next?
SUI price remains positioned at a critical intersection of regulatory positioning and technical structure. Recent…
- Price Analysis
Bitcoin Price Alarming Pattern Points to a Dip to $80k as $2.7b Options Expires Today
Bitcoin price rebounded by 3% today, Dec. 19, reaching a high of $87,960. This rise…
- Price Analysis
Dogecoin Price Prediction Points to $0.20 Rebound as Coinbase Launches Regulated DOGE Futures
Dogecoin price has gone back to the spotlight as it responds to the growing derivatives…
- Price Analysis
Pi Coin Price Prediction as Expert Warns Bitcoin May Hit $70k After BoJ Rate Hike
Pi Coin price rose by 1.05% today, Dec. 18, mirroring the performance of Bitcoin and…
- Price Analysis
Cardano Price Outlook: Will the NIGHT Token Demand Surge Trigger a Rebound?
Cardano price has entered a decisive phase as NIGHT token liquidity rotation intersects with structural…