Is Cardano Price Breakdown below $0.3 an Opportunity for Higher Gains?
Within a month, the Cardano price has shown aggressive correction in the daily time frame chart. From the $0.3793 high on July 14th, the coin price tumbled a 23% drop and reached the current trading price of $0.23. However, the falling price has started showing a falling wedge pattern which hints at the maturity of a downward trend; is this the right time to buy?
Also Read: Cardano Welcomes New Updates as Transaction Count Tops 73M
Key Points From Cardano Analysis
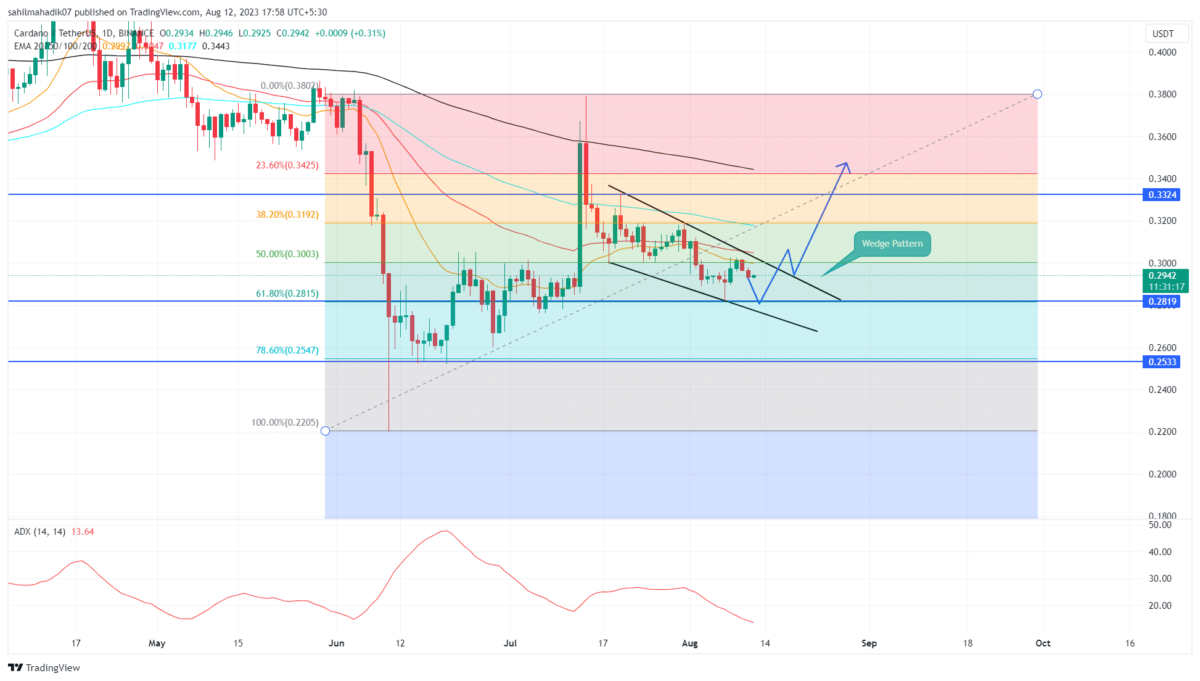
- A falling wedge pattern shapes the current downfall in ADA price
- A bullish breakout from the overhead trendline would set the ADA price for a 13.5% upswing
- The intraday trading volume in the ADA coin is $120.6 Million, indicating a 27% gain.
On August 7th, the falling Cardano price witnessed strong support at the confluence point for 61.8% Fibonacci Retracement level and a lower trendline of the wedge pattern. In theory, the aforementioned FIB level is indeed strong support but after the breakdown of the 50% retracement level, the coin holders must remain cautious.
Thus, the bullish reversal pushed the price to 7% to rechallenge the overhead resistance trendline. Currently, the ADA price trades at $0.294 and may continue its downward trend until the two converging trend lines are intact.
A potential breakout from the overhead resistance will surge the coin price 13.45% higher to reach the $0.332 mark.
[converter id=”ada-cardano” url=”https://coingape.com/price/converter/cardano-to-usd/?amount=1″]
Will ADA Price Extend Correction Phase?
While the opportunity of a bullish upswing seems in favor, the increasing FUD in overall market sentiment cannot be ignored. If the overhead supply pressure rises, a breakdown below the wedge pattern’s lower trendline will provide sellers with an additional barrier to pressurize buyers. This breakdown could prolong the correction phase to $0.255.
- Average Direction Index: The falling ADX price may reflect the weakening bullish momentum.
- Exponential Moving Average: The coin price trading below the daily EMAs(20, 50, 100, and 200) indicates the path to least resistance for traders is downward.
Recent Posts
- Price Analysis
Expert Predicts Ethereum Price Rebound to $4k as BitMine, Long-Term Holders Buy
Ethereum price rose by 1.5% today and moved slightly above the important resistance level at…
- Price Analysis
Bitcoin Price Prediction Ahead of FOMC Minutes
Bitcoin price continues trading within a tightening range, with BTC price holding between $88,000 and…
- Price Analysis
U.S. Government Shutdown Looms: These 3 Crypto Predictions Could Explode
As the January trading session unfolds, the crypto market rose 1.07% in 24 hours, showing…
- Price Analysis
Grayscale Files for First U.S. Bittensor ETF: Will TAO Price Rally to $300 in January?
Bittensor (TAO) price climbed above $220 in the last 24 hours after Grayscale filed for…
- Price Analysis
Shiba Inu Price Prediction: Will SHIB Show Golden Cross Signal in 2026?
Discussion around a potential Golden Cross in 2026 has intensified as Shina Inu price compresses…
- Price Analysis
Pi Network Price Prediction as Demand Slips Ahead of the 136m Unlock
Pi Network price is stuck in a bear market this month, and odds are high…