Is Coinbase Stock Price Below $100 a Bearish Sign or Pullback for Higher Gains?


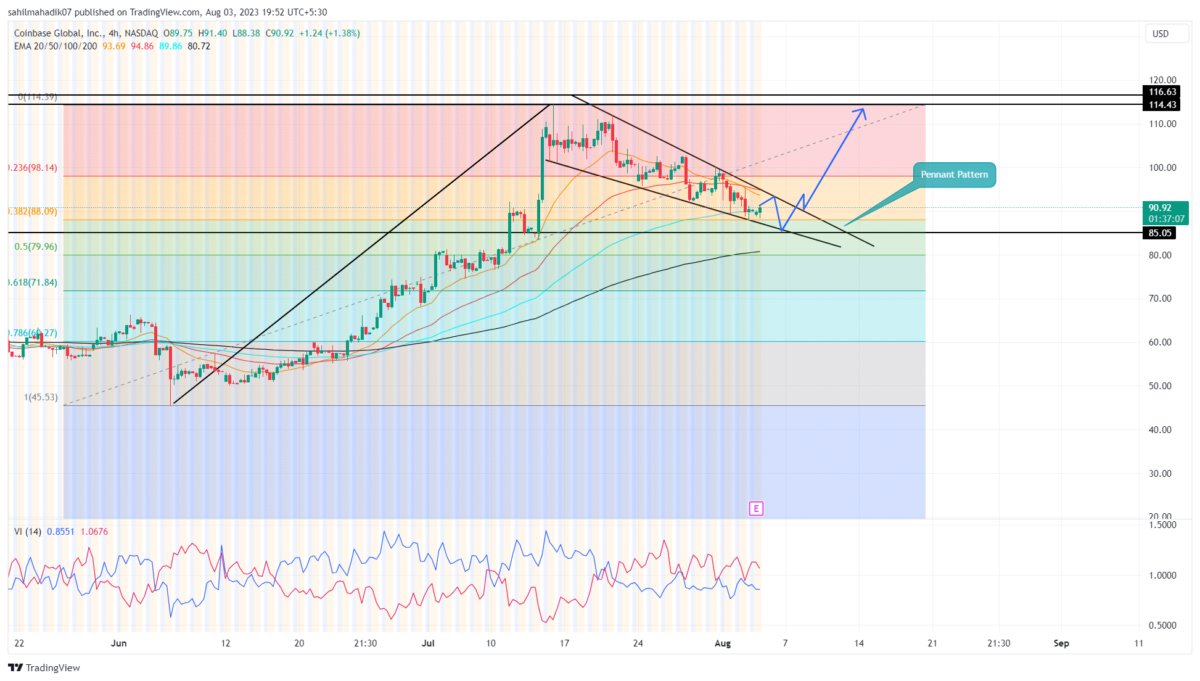
Amid the increased supply pressure in the broader market, the Coinbase stock price witnessed a sharp correction from the $114.43 high. So far the bearish pullback has tumbled the price 20.8% and pushed its current trading price of $90.43. However, a closer look at the 4-hour time frame chart shows his retracement has shaped into a pennant pattern, which is a strong bullish continuation setup.
Also Read: Bitcoin Bull Cathie Wood Sells Coinbase And Robinhood Shares, Expects Weak Q2 Earnings?
Coinbase Stock Price Daily Chart
- A bullish breakout from the overhead trendline of the pennant pattern will signal the resumption of the bullish rally.
- The $85 support stands as strong support for buyers
- A potential bullish crossover between the 100-and-200-day EMAs could bolster the long-term uptrend
 Source-Tradingview
In the last three weeks, the Coinshare stock price has rebounded twice from the overhead trendline and thrice from the lower trendline indicating the strong influence of the pennant pattern on market participants.
By the press time, the $COIN price trades at $89.8 and shows signs of bullish reversal at the support trendline. This reversal could set a short jump of 3.5% before rising above the trendline. Until these two trendlines are intact, the ongoing correction will persist and extend the downward trend.
However, the bullish nature of this chart setup will bolster buyers to break the above trendline. This break with 4-hour candle closing will provide buyers with a suitable springboard to continue the prevailing uptrend. The post-breakout rally could surge the asset price by nearly 26% and rechallenge the $114.4.
Is the Overall Trend Still Bullish?
As per the Fibonacci retracement tool, which helps traders identify potential support and resistance levels during a correction phase, the Coinbase share is above the 38.2% level. In technical analysis, a correction to a 50% FIB level is healthy and usually bolsters the continuation of the prior trend. Alternatively, if the asset price falls below 50% the traders must remain cautious.
- Exponential Moving Average: A breakdown below the 20-day EMA hints at the extension of the correction phase.
- Vortex Indicator: A bearish crossover between the VI+(blue) and VI-(orange) slope indicates the bearish momentum is aggressive.

Why Trust CoinGape
CoinGape has covered the cryptocurrency industry since 2017, aiming to provide informative insights Read more…to our readers. Our journal analysts bring years of experience in market analysis and blockchain technology to ensure factual accuracy and balanced reporting. By following our Editorial Policy, our writers verify every source, fact-check each story, rely on reputable sources, and attribute quotes and media correctly. We also follow a rigorous Review Methodology when evaluating exchanges and tools. From emerging blockchain projects and coin launches to industry events and technical developments, we cover all facets of the digital asset space with unwavering commitment to timely, relevant information.

Related Articles


- Peter Thiel Exits ETHZilla as Stock Slides 3% Amid Token Launch
- Bitwise, Granitshares Eyes $63B Sector With New Prediction Markets ETF Filing
- Breaking: Grayscale Sui Staking ETF to Start Trading on NYSE Arca Today
- Prediction Market Lawsuit: Nevada Targets Kalshi in Court After Action Against Polymarket
- Robinhood to Raise $1B IPO to Open Private Markets to Retail Investors
- Pi Network Price Beats Bitcoin, Ethereum, XRP as Upgrades and Potential CEX Listing Fuels Demand
- 5 Things Dogecoin Price Needs to Hit $0.20 in Feb 2026
- Bitcoin Price Prediction as Experts Warns of Quantum Risks
- Dogecoin, Shiba Inu, Pepe Coin Price Predictions As BTC Crashes Below $68k
- Ethereum Price Outlook as Harvard Shifts Focus from Bitcoin to ETH ETF
- HOOD and COIN Stock Price Forecast as Expert Predicts Bitcoin Price Crash to $10k


