Is Coinbase Stock Price Below $100 a Bearish Sign or Pullback for Higher Gains?
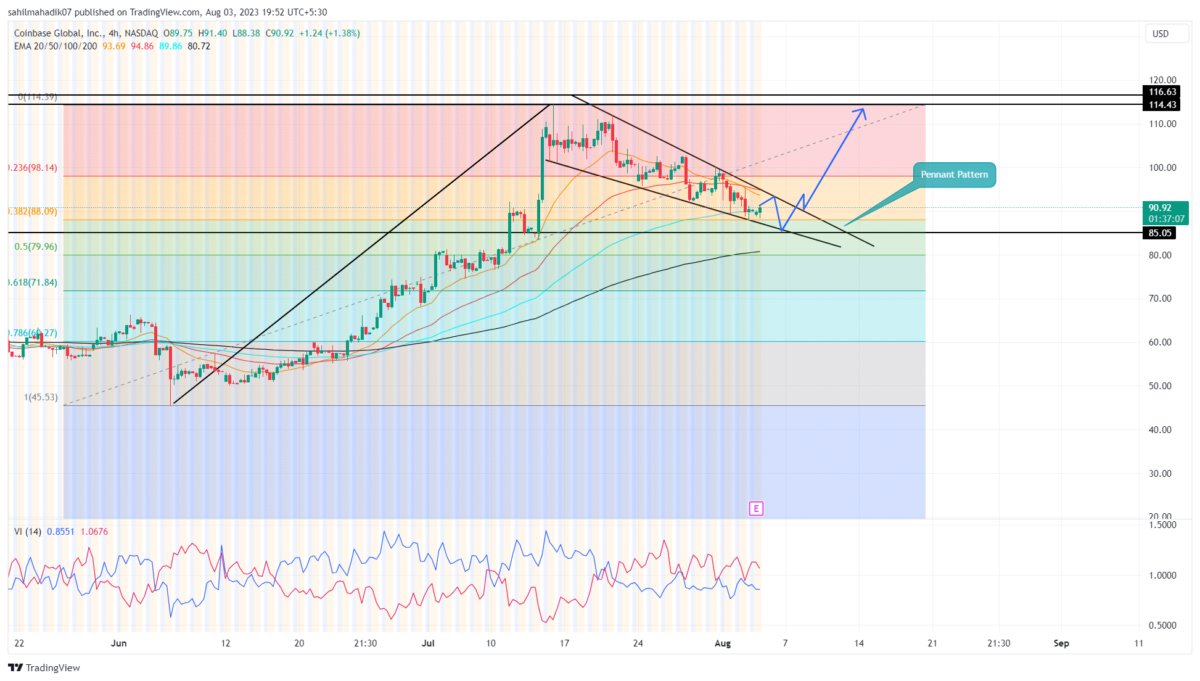
Amid the increased supply pressure in the broader market, the Coinbase stock price witnessed a sharp correction from the $114.43 high. So far the bearish pullback has tumbled the price 20.8% and pushed its current trading price of $90.43. However, a closer look at the 4-hour time frame chart shows his retracement has shaped into a pennant pattern, which is a strong bullish continuation setup.
Also Read: Bitcoin Bull Cathie Wood Sells Coinbase And Robinhood Shares, Expects Weak Q2 Earnings?
Coinbase Stock Price Daily Chart
- A bullish breakout from the overhead trendline of the pennant pattern will signal the resumption of the bullish rally.
- The $85 support stands as strong support for buyers
- A potential bullish crossover between the 100-and-200-day EMAs could bolster the long-term uptrend
In the last three weeks, the Coinshare stock price has rebounded twice from the overhead trendline and thrice from the lower trendline indicating the strong influence of the pennant pattern on market participants.
By the press time, the $COIN price trades at $89.8 and shows signs of bullish reversal at the support trendline. This reversal could set a short jump of 3.5% before rising above the trendline. Until these two trendlines are intact, the ongoing correction will persist and extend the downward trend.
However, the bullish nature of this chart setup will bolster buyers to break the above trendline. This break with 4-hour candle closing will provide buyers with a suitable springboard to continue the prevailing uptrend. The post-breakout rally could surge the asset price by nearly 26% and rechallenge the $114.4.
Is the Overall Trend Still Bullish?
As per the Fibonacci retracement tool, which helps traders identify potential support and resistance levels during a correction phase, the Coinbase share is above the 38.2% level. In technical analysis, a correction to a 50% FIB level is healthy and usually bolsters the continuation of the prior trend. Alternatively, if the asset price falls below 50% the traders must remain cautious.
- Exponential Moving Average: A breakdown below the 20-day EMA hints at the extension of the correction phase.
- Vortex Indicator: A bearish crossover between the VI+(blue) and VI-(orange) slope indicates the bearish momentum is aggressive.
Recent Posts
- Price Analysis
Bitcoin Price Prediction As Michael Saylor Pauses BTC Purchase- Is A Fall to $74k Imminent?
Michael Saylor's Strategy has paused additional BTC purchases while increasing cash reserves, prompting renewed speculation…
- Price Analysis
Aster launched Phase 5 Buyback Program Allocating 80% Fees. Will ASTER Price Rally?
Aster price hovered above $0.70 following a 2.67% daily gain, supported by a bullish market…
- Price Analysis
XRP Price Prediction: Rare Bullish Patterns Align With Powerful Catalysts
The XRP price has stabilized in the past few days as it jumped by ~9%…
- Price Analysis
Weekly Crypto Price Prediction: Bitcoin, Ethereum, and XRP as Market Momentum Builds
As Christmas week begins, the crypto market shows early signs of recovery. Over the past…
- Price Analysis
Will Solana Price Hit $150 as Mangocueticals Partners With Cube Group on $100M SOL Treasury?
Solana price remains a focal point as it responds to both institutional alignment and shifting…
- Price Analysis
SUI Price Forecast After Bitwise Filed for SUI ETF With U.S. SEC – Is $3 Next?
SUI price remains positioned at a critical intersection of regulatory positioning and technical structure. Recent…