Is Dogecoin Price Headed to $0.85? Flag Pattern Hints 12% Rally in Play


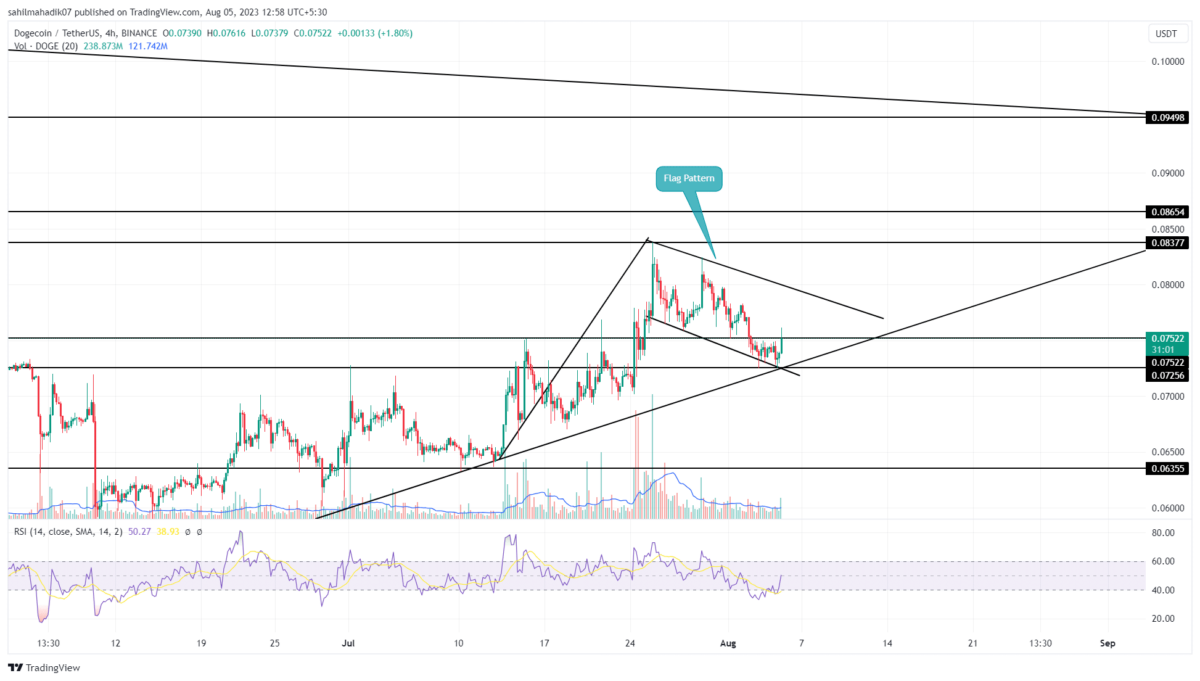
Amidst the prevailing bearish sentiment in the cryptocurrency market, the Dogecoin (DOGE) price underwent a correction phase after encountering resistance at the $0.0838 level. In the past two weeks, the memecoin tumbled 13.4% and reached a monthly low of $0.725. However, this pullback in the daily chart shows the formation of a bullish continuation pattern called flag. Here’s how traders could use patterns to enter the next recovery cycle.
Also Read: Elon Musk Says X Will Never Launch A Crypto Token, Bullish For Dogecoin?
Dogecoin Price Daily Chart
- The Dogecoin price above 200-day indicates the long-term trend remains bullish.
- The formation of a flag pattern could trigger a significant upswing in Doge price
- The 24-hour trading volume in the Dogecoin coin is $366.5 Million, indicating a 0.3% gain
 Source-Tradingview
The downward trend in Dogecoin price has found suitable support at the lower trendline of the flag pattern. Amid the rising AUD in the market, the coin price has been hovering above the aforementioned for the past three days.
The daily candles with lower price rejection indicate the buyers are witnessing demand pressure at this support which increases the possibility of a bullish reversal. With an intraday gain of 2.64% the buyers breached immediate resistance of $0.075.
If the candle closes close above the aforementioned resistance the buyers would drive a rally 5% higher to rechallenge the overhead trendline. Until the falling trendline of the pattern is intact, the ongoing correction phase would extend longer.
[converter id=”doge-dogecoin” url=”https://coingape.com/price/converter/doge-to-usd/?amount=1″]
Can DOGE Price Surpass $0.85?
The formation of flag patterns offers a pullback opportunity for traders to enter at discounted prices. A potential bullish breakout from the overhead trendline would signal the end of the correction phase. Under an ideal bullish condition, the Dogecoin price may hit the first target at $0.85, followed by a rally to $0.093.
- Exponential moving average: A potential bearish crossover between the 20-and-50-day EMAs could extend the current downward trend.
- Relative Strength Index: The daily RSI slope above 50% indicates the buyer’s momentum is rising for sustained reversal.

Why Trust CoinGape
CoinGape has covered the cryptocurrency industry since 2017, aiming to provide informative insights Read more…to our readers. Our journal analysts bring years of experience in market analysis and blockchain technology to ensure factual accuracy and balanced reporting. By following our Editorial Policy, our writers verify every source, fact-check each story, rely on reputable sources, and attribute quotes and media correctly. We also follow a rigorous Review Methodology when evaluating exchanges and tools. From emerging blockchain projects and coin launches to industry events and technical developments, we cover all facets of the digital asset space with unwavering commitment to timely, relevant information.

Related Articles


- Will Bitcoin & Gold Fall Today as Trump Issues Warning to Iran Before Key Nuclear Talks?
- Epstein File Reveals Crypto Controversy: 2018 Emails Reference Gary Gensler Talks
- Wintermute Expands Into Tokenized Gold Trading, Forecasts $15B Market in 2026
- Bitcoin Shows Greater Weakness Than Post-LUNA Crash; Is a Crash Below $60K Next?
- XRP Tops BTC, ETH in Institutional Flows As Standard Chartered Lowers 2026 Forecasts
- Dogecoin, Shiba Inu, Pepe Coin Price Predictions As BTC Crashes Below $68k
- Ethereum Price Outlook as Harvard Shifts Focus from Bitcoin to ETH ETF
- HOOD and COIN Stock Price Forecast as Expert Predicts Bitcoin Price Crash to $10k
- XRP Price Prediction Ahead of Supreme Court Trump Tariff Ruling
- Crypto Price Prediction For This Week: Dogecoin, Solana and Cardano
- Bitcoin Price Prediction: How Could Brazil’s Strategic Bitcoin Reserve Proposal Impact BTC?


