Is Dogecoin Price Poised for a 20% Downfall? Key Indicators to Watch


Amid the indecisive sentiment in the crypto market, the Dogecoin price carries a silent recovery under the influence of two rising trendlines. However, these converging trendlines are part of a bearish continuation pattern called an inverted flag project, the popular memecoin would face a longer correction. In the last five, the coin price has reverted several times from the aforementioned trendline, indicating the traders are strictly following this chart setup.
Also Read: Tesla Retains Dogecoin As Payment Option; Removes Bitcoin
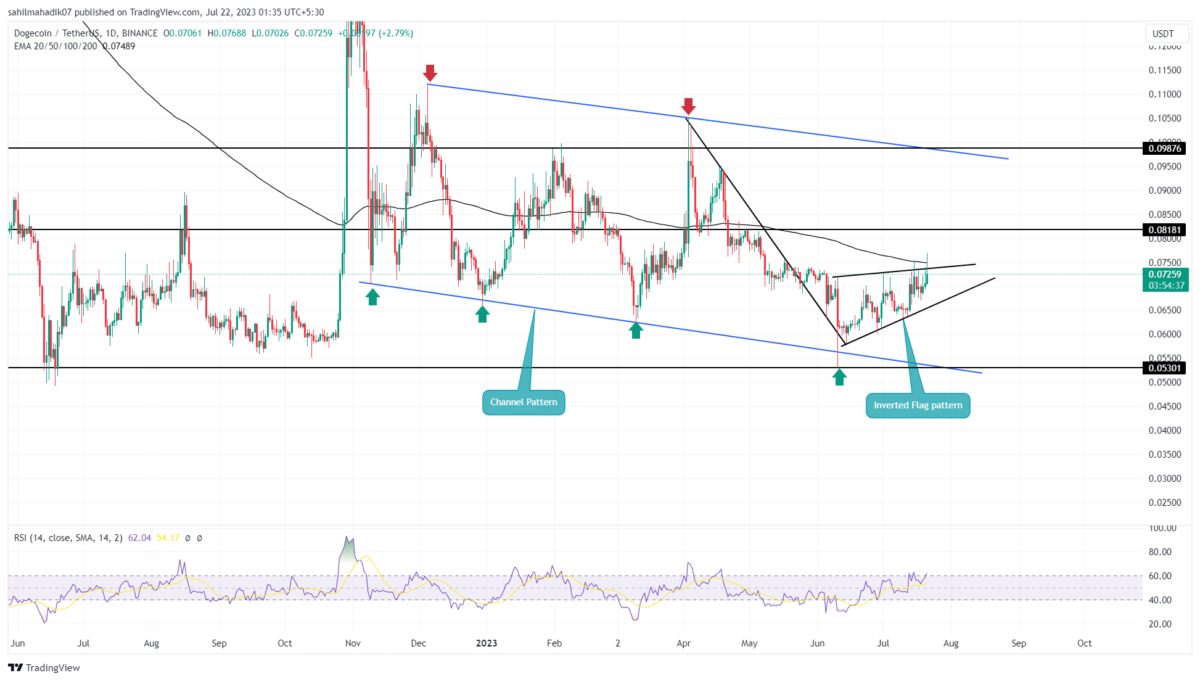
Dogecoin Price Daily Chart
- A long wick rejection candle at the overhead trendline indicates the sellers continue to defend the bearish pattern.
- A breakdown below the lower support trendline would tumble the DOGE price by 20%
- The 24-hour trading volume in the Dogecoin coin is $739.5 Million, indicating a 24% gain
 Source-Tradingview
Earlier today with an intraday gain of 8.76%, the Dogecoin price showed another attempt to breach the overhead trendline of inverted pennant. However, the buyers face active selling pressure at this trendline, which plunged the coin price back and is currently trading at $0.0724.
If the daily candle closes near the current level, the DOGE price may plunge lower as the overhead supply persists strong. The potential downfall may tumble the memecoin 6-7% down to retest the lower trendline.
Until the two trendlines are intact, the coin price could prolong the current recovery rally higher. However, the buyers will obtain a better confirmation of a bullish recovery, the coin price manages to breach the upper trendline.
[converter id=”doge-dogecoin” url=”https://coingape.com/price/converter/doge-to-usd/?amount=1″]
Will $DOGE Price Recovery Continue?
The converging trendline of the pennant pattern indicates the Dogecoin price is poised for a breakout opportunity. While the mentioned pattern is a downtrend continuation pattern, the memecoin is likely to break the lower trendline. This breakout will release the build-up selling pressure, and lead the coin price back to the $0.053 mark.
- Exponential Moving Average: The 200-day EMA acts as a major resistance reflecting the overall trend is still bearish.
- Relatives strength index: For the same price high near $0.075, the daily RSI slope shows significant growth indicating the buyer’s attempts to push the price higher are getting undermined.
Why Trust CoinGape
CoinGape has covered the cryptocurrency industry since 2017, aiming to provide informative insights Read more…to our readers. Our journal analysts bring years of experience in market analysis and blockchain technology to ensure factual accuracy and balanced reporting. By following our Editorial Policy, our writers verify every source, fact-check each story, rely on reputable sources, and attribute quotes and media correctly. We also follow a rigorous Review Methodology when evaluating exchanges and tools. From emerging blockchain projects and coin launches to industry events and technical developments, we cover all facets of the digital asset space with unwavering commitment to timely, relevant information.