

Is Ethereum Price Correction Phase Extending? Potential 5% Drop in Sight


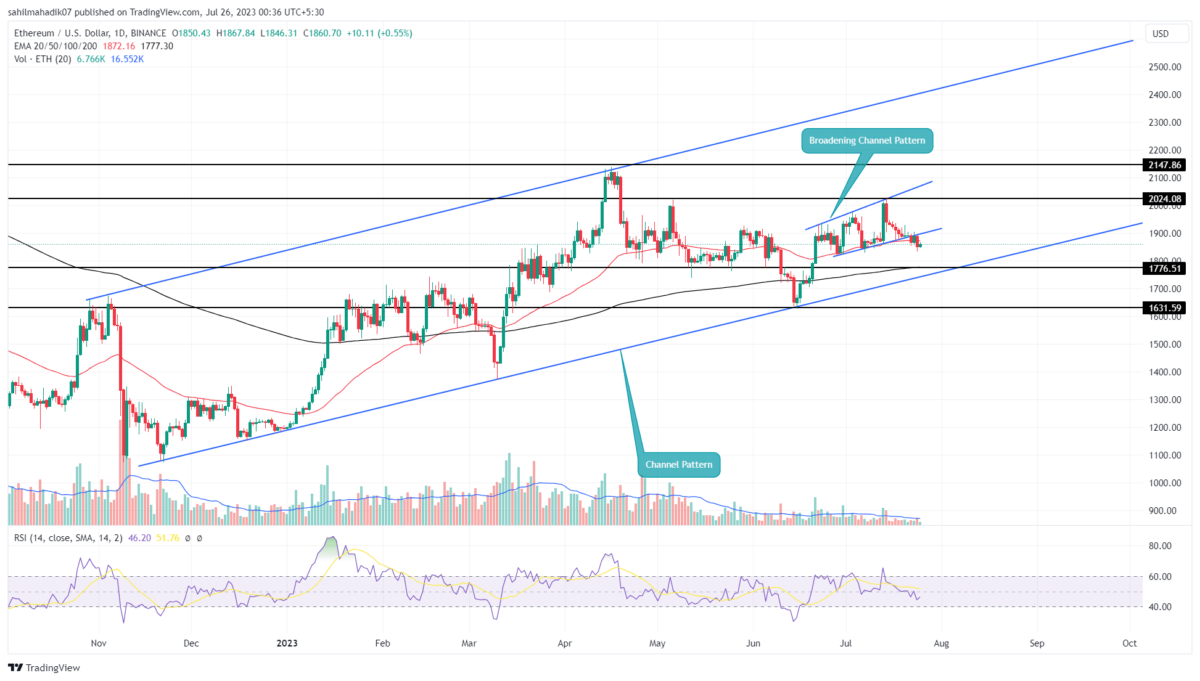
The Ethereum price prolongs its correction trend, as the largest cryptocurrency Bitcoin resulted in its month-long correction on a bearish note. Within a fortnight, the Ethereum price has plunged from a high of $2028 to a current price of $1862, registering a 7.8% loss. Amid this downfall, the coin price also breached the support trendline of the megaphone pattern suggesting further downfall in ETH.
Also Read: Ethereum Price Charts Signals 18% Upside; Liquid Staking Hits ATH in 2023
Ethereum Price Daily Chart
- The strong support of the rising trendline could offer buyers an opportunity to rebound.
- The Ethereum Fear and Greed index at 46% reflect a neutral sentiment among traders
- The intraday trading volume in Ether is $4.13 Billion, indicating a 36% loss.
 Source- Tradingview
For over a month, the Ethereum price showcased a silent recovery within the divergence trendline of the Megaphone pattern. This pattern formation is a sign of uncertainty and increasing volatility among market participants.
With the recent downturn in the crypto market, the ETH price breached the support trendline of the aforementioned pattern on July 22nd. This crackdown flipped significant support into a potential resistance that sellers can use to pressurize the coin price lower.
If the coin sellers manage to sustain this breakdown, the altcoin price could fall 4-5% to reset the ascending trendline at $1775. This trendline currently maintains the overall uptrend in the second-largest cryptocurrency and offers a dip opportunity to interested buyers.
Can ETH Price Regain Bullish Momentum?
Taking a look at the bigger picture, the rising channel pattern is leading to an uptrend in Ethereum price. In the last eight months, the price retest to the lower trendline of this pattern has bolstered buyers with bullish momentum to create a new high of 2023. Thus, the crypto holders must keep a watch on the support trendline of signs of a reversal to catch the next recovery cycle.
- Relative Strength Index: The daily RSI slope below 50% reflects a weakening bullish momentum
- Exponential Moving Average: The 200-day EMA walking along with a lower trendline increases the support strength of the channel pattern.

Why Trust CoinGape
CoinGape has covered the cryptocurrency industry since 2017, aiming to provide informative insights Read more…to our readers. Our journal analysts bring years of experience in market analysis and blockchain technology to ensure factual accuracy and balanced reporting. By following our Editorial Policy, our writers verify every source, fact-check each story, rely on reputable sources, and attribute quotes and media correctly. We also follow a rigorous Review Methodology when evaluating exchanges and tools. From emerging blockchain projects and coin launches to industry events and technical developments, we cover all facets of the digital asset space with unwavering commitment to timely, relevant information.
Premium Partners


Related Articles


- Trump Tariffs: Crypto Traders Increase Bets On Supreme Court Ruling as Cooling Inflation Fuels Rate Cut Hopes
- Pro-Crypto Amir Zaidi Appointed as CFTC Chief Of Staff Following Bitcoin Futures Milestone
- Breaking: CLARITY Act Set to Advance as Senate Picks January 15 for Crypto Bill Markup
- Crypto Market Gets Year-end Boost as Fed Injects $74 Billion Into Economy
- Tom Lee’s BitMine Increases Staked ETH to $1.3B as Ethereum Tops Solana and BNB in 2025 Flows
- Expert Predicts Ethereum Price Rebound to $4k as BitMine, Long-Term Holders Buy
- Bitcoin Price Prediction Ahead of FOMC Minutes
- Top 3 Crypto Predictions Ahead of U.S. Government Shutdown Deadline in Jan 2026
- Grayscale Files for First U.S. Bittensor ETF: Will TAO Price Rally to $300 in January?
- Shiba Inu Price Prediction: Will SHIB Show Golden Cross Signal in 2026?
- Pi Network Price Prediction as Demand Slips Ahead of the 136m Unlock


