Is Ethereum Price Correction Phase Extending? Potential 5% Drop in Sight
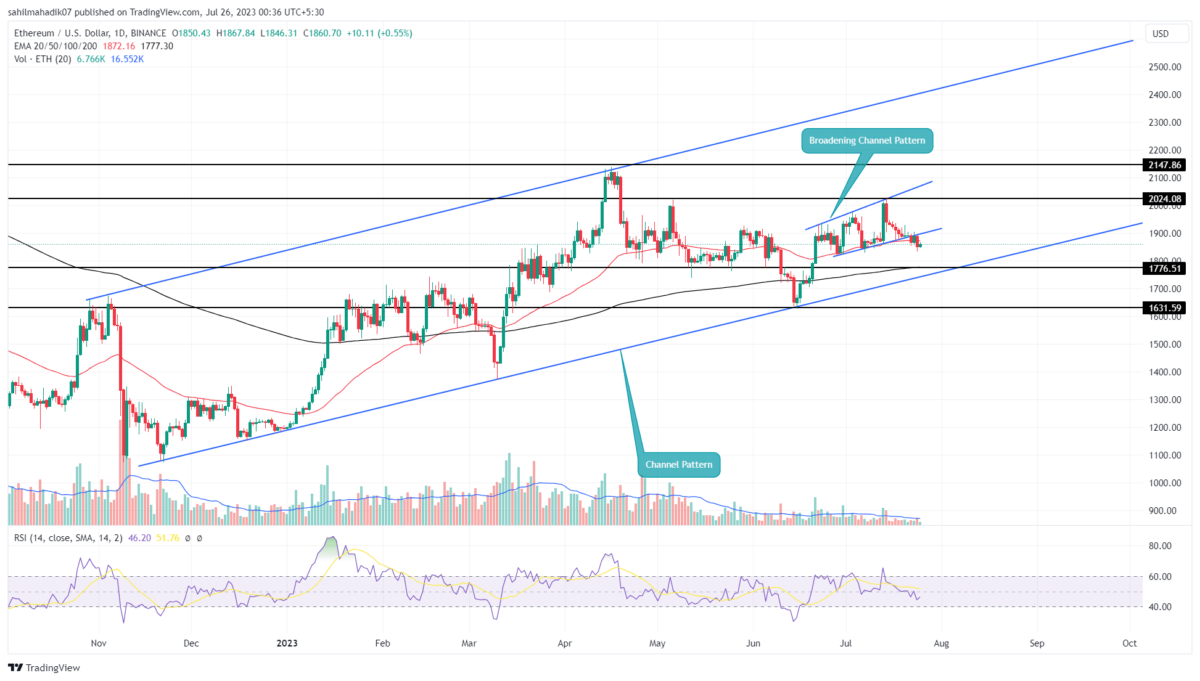
The Ethereum price prolongs its correction trend, as the largest cryptocurrency Bitcoin resulted in its month-long correction on a bearish note. Within a fortnight, the Ethereum price has plunged from a high of $2028 to a current price of $1862, registering a 7.8% loss. Amid this downfall, the coin price also breached the support trendline of the megaphone pattern suggesting further downfall in ETH.
Also Read: Ethereum Price Charts Signals 18% Upside; Liquid Staking Hits ATH in 2023
Ethereum Price Daily Chart
- The strong support of the rising trendline could offer buyers an opportunity to rebound.
- The Ethereum Fear and Greed index at 46% reflect a neutral sentiment among traders
- The intraday trading volume in Ether is $4.13 Billion, indicating a 36% loss.
For over a month, the Ethereum price showcased a silent recovery within the divergence trendline of the Megaphone pattern. This pattern formation is a sign of uncertainty and increasing volatility among market participants.
With the recent downturn in the crypto market, the ETH price breached the support trendline of the aforementioned pattern on July 22nd. This crackdown flipped significant support into a potential resistance that sellers can use to pressurize the coin price lower.
If the coin sellers manage to sustain this breakdown, the altcoin price could fall 4-5% to reset the ascending trendline at $1775. This trendline currently maintains the overall uptrend in the second-largest cryptocurrency and offers a dip opportunity to interested buyers.
Can ETH Price Regain Bullish Momentum?
Taking a look at the bigger picture, the rising channel pattern is leading to an uptrend in Ethereum price. In the last eight months, the price retest to the lower trendline of this pattern has bolstered buyers with bullish momentum to create a new high of 2023. Thus, the crypto holders must keep a watch on the support trendline of signs of a reversal to catch the next recovery cycle.
- Relative Strength Index: The daily RSI slope below 50% reflects a weakening bullish momentum
- Exponential Moving Average: The 200-day EMA walking along with a lower trendline increases the support strength of the channel pattern.
Recent Posts
- Price Analysis
Cardano Price Outlook: Will the NIGHT Token Demand Surge Trigger a Rebound?
Cardano price has entered a decisive phase as NIGHT token liquidity rotation intersects with structural…
- Price Analysis
Will Bitcoin Price Crash to $74K as Japan Eyes Rate Hike on December 19?
Bitcoin price continues to weaken after breaking below its recent consolidation range, now trading within…
- Price Analysis
Bitwise Predicts Solana Price Will Hit New All-Time Highs in 2026
Solana price declined by 4% over the past 24 hours, breaking below the key $130…
- Price Analysis
Bitcoin Price Outlook: Capriole Founder Warns of a Drop Below $50K by 2028
Bitcoin price narratives continue to evolve as long-term downside risks regain attention. Bitcoin price discussions…
- Price Analysis
XRP Price Rare Pattern Points to a Surge to $3 as ETFs Cross $1B Milestone
XRP price dropped by 1.2% today, Dec. 17, continuing a downward trend that started in…
- Price Analysis
DOGE Whales Add 138M Coins in 24 Hours: Will Dogecoin Price Rebound Above $0.15?
Dogecoin price traded at $0.1304 on Tuesday, up 1.39% in the last 24 hours.…